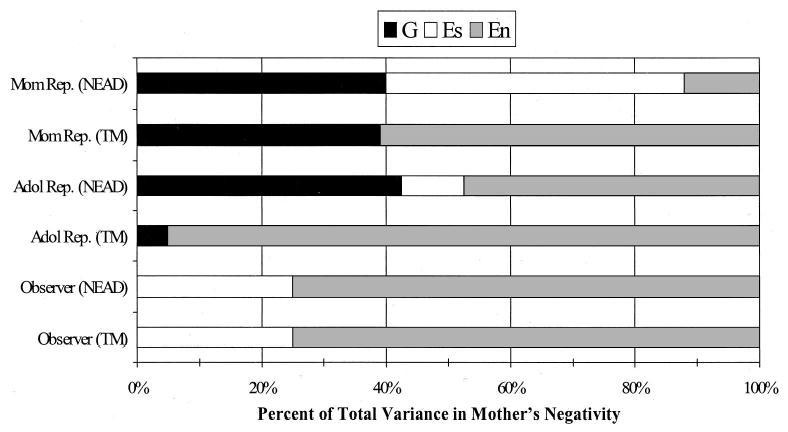
Figure 3.

Percentage of variance explained by genetic (G), shared environmental (Es), and nonshared environmental (En) influences from the best-fitting model results for maternal negativity. Mother reports (Mom Rep.) are presented in the top two bars, adolescent reports (Adol Rep.) in the middle two bars, and observer ratings in the bottom two bars. NEAD = Nonshared Environment in Adolescent Development project; TM = Twin Moms project.
