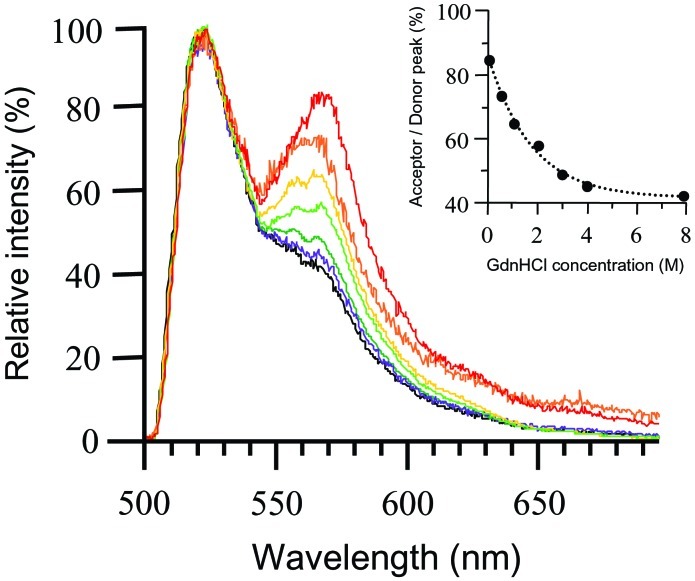
Figure 1.
Sensitivity of energy transfer to Fn-D/A unfolding in denaturing solution. Fn-D/A emission spectra were measured by using an epifluorescence microscope with an attached spectrometer. Spectra were normalized to the donor peak so that changes in energy transfer were indicated by changes in the acceptor peak. Fn-D/A was progressively denatured over a range of Gdn⋅HCl concentrations, from 0 M to 8 M. Fn-D/A in 0 M Gdn⋅HCl is shown in red, 0.5 M in orange, 1 M in yellow, 2 M in light green, 3 M in dark green, 4 M in purple, and 8 M in black. The emission spectrum of Fn-D/A in 8 M Gdn⋅HCl was indistinguishable from that of a mixture of free donor and acceptor fluorophores in PBS. The small shoulder at 570 nm at 8 M Gdn⋅HCl was not caused by energy transfer, but by superposition of the donor fluorescence tail and fluorescence from direct excitation of the acceptor. (Inset) FRET (acceptor peak divided by donor peak) as a function of Gdn⋅HCl concentration.

