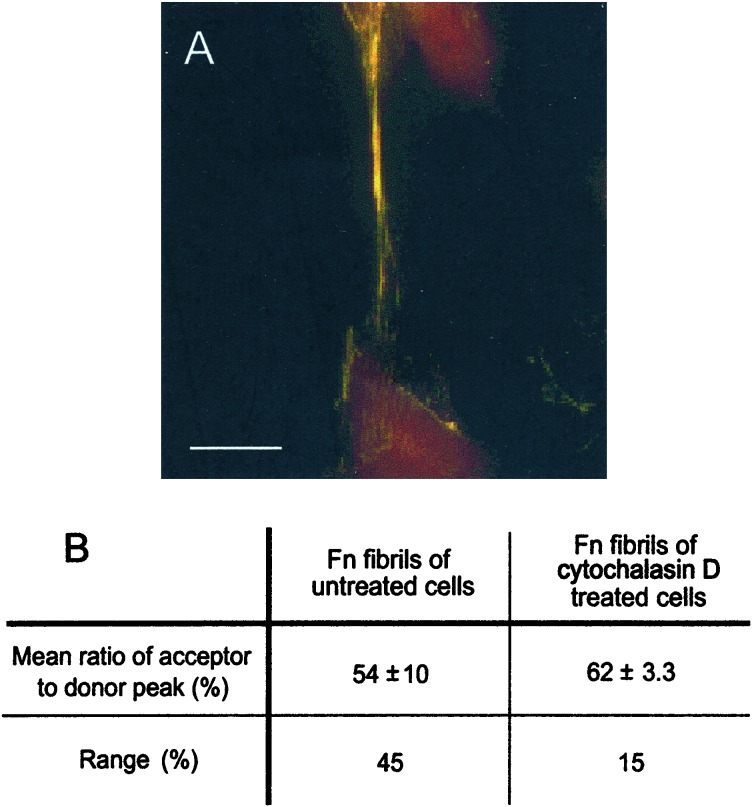
Figure 3.
Effect of cytochalasin D on conformation of Fn-D/A in matrix fibrils. (A) Fluorescence image of fibril after treatment of cells with 10 μM cytoD for 1 h after incorporation of Fn-D/A into fibrils. Fibrils in cell samples treated with cytoD appeared predominantly yellow, indicating a higher level of FRET than in the predominantly green fibrils of untreated samples. The increase in FRET indicated that cytoD allowed refolding of Fn-D/A in fibrils relative to untreated samples. (Scale bar, 10 μm.) (B) The mean level of FRET (acceptor peak divided by donor peak) from fibrils in untreated samples, 54% ± 10% (n = 115, 11 fibrils), was significantly lower than in samples treated with cytoD, 62 ± 3.3% (n = 78,8 fibrils) (P < 0.001, two-sample t test). The range of FRET in fibrils of cytoD-treated cells (15%) was also narrower than that of untreated cells (45%).

