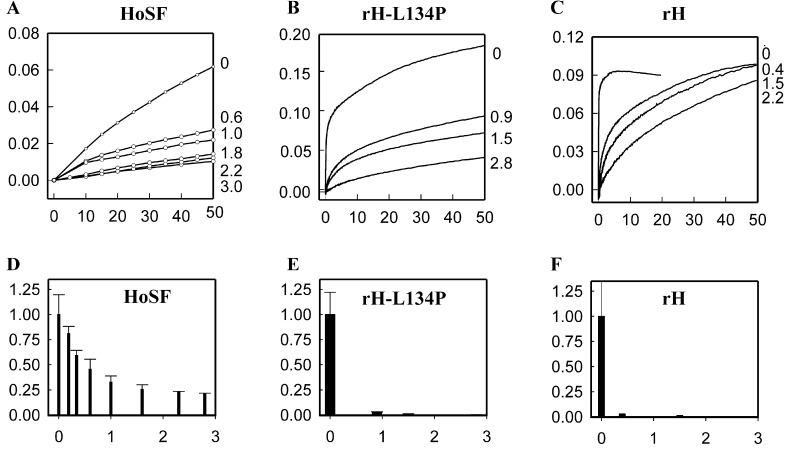
Figure 4.
Inhibition of Fe(II) oxidation in Cr(TREN)–ferritin complexes. (Upper) The rates of Fe oxidation as the diferric oxo and ferric oxo mineral (A350nm) for HoSF (H/L ≈ 0.2), and for rH, rH-L134P, and plotted vs. Cr(TREN) bound per subunit (shown at right). In HoSF iron oxidation was monitored 10 s after addition of Fe2+; final concentrations: [Fe2+] 0.25 mM, protein 2 μM, [NaCl] 0.2 M, pH 7.0 [0.1 M 4-morpholinepropanesulfonic acid (Mops)]. In rH-L134P and rH iron oxidation was monitored within 10 ms after addition of Fe2+ by using stopped-flow spectrophotometry; final concentrations: [Fe2+] 80 μM, protein 1.6 μM, [NaCl] 0.2 M, pH 7.0 (0.1 M Mops). Unbound Cr(TREN) was removed by dialysis. (Lower) The initial rate (vi = ΔA350nm/min) in the presence of varying amounts of Cr(TREN) per subunit. This is normalized to the free protein (vo) and shown as a function of Cr(TREN) bound per subunit.

