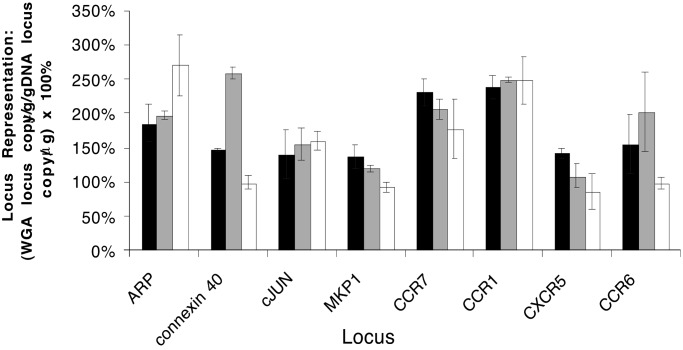
Figure 3.
Gene coverage comparison of MDA-amplified DNA from blood, tissue culture cells, and pure DNA. Quantitative PCR was used to measure the yield of specific DNA fragments in amplified DNA preparations relative to genomic DNA. Reactions omitted a heat denaturation step, and alkaline lysis of blood and cells was carried out as described. The representation of eight loci in the amplified samples relative to pure DNA was determined by using TaqMan quantitative PCR. Black bars depict the locus representation of DNA amplified directly from blood. Gray bars depict the locus representation of DNA amplified from purified genomic DNA (30 ng, representing 9,000 gene copies). White bars depict the locus representation of DNA amplified from tissue culture cells (10 cell equivalents of DNA).

