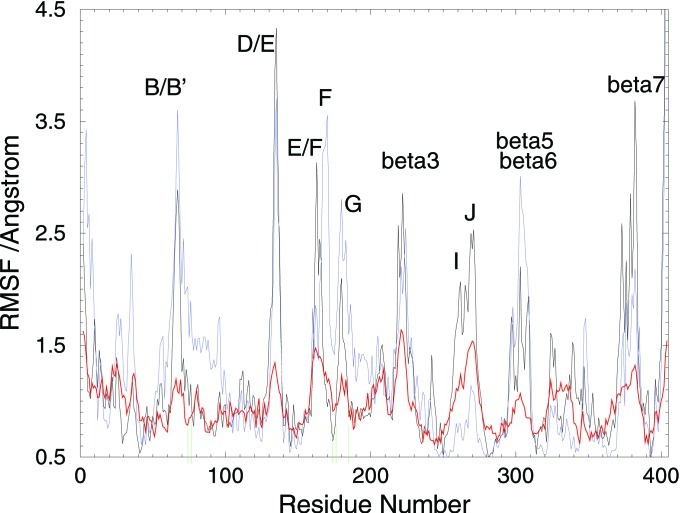
Figure 4.
Comparison of the dynamics [residue-wise root mean square fluctuation (RMSF)] of P450eryF for the crystal structure (red) and MD simulations of the wild-type protein (black) and the R185M mutant (blue). The green lines on the x axis indicate residues A74, L76, I174, V176, and R185. The locations of the peaks in RMSF of the residues in the channel region are similar in all three curves. The four hydrogen bonds to R185 locally reduce the RMSFs in all three curves but the effect is clearly the smallest for the R185M mutant. After partial breaking or rearrangement of these H-bonds, considerable conformational freedom is expected in the B/B′ and F/G loop regions, thus allowing channel opening. In the R185M simulation the N-terminal residues also show greater flexibility, which is required for channel opening.

