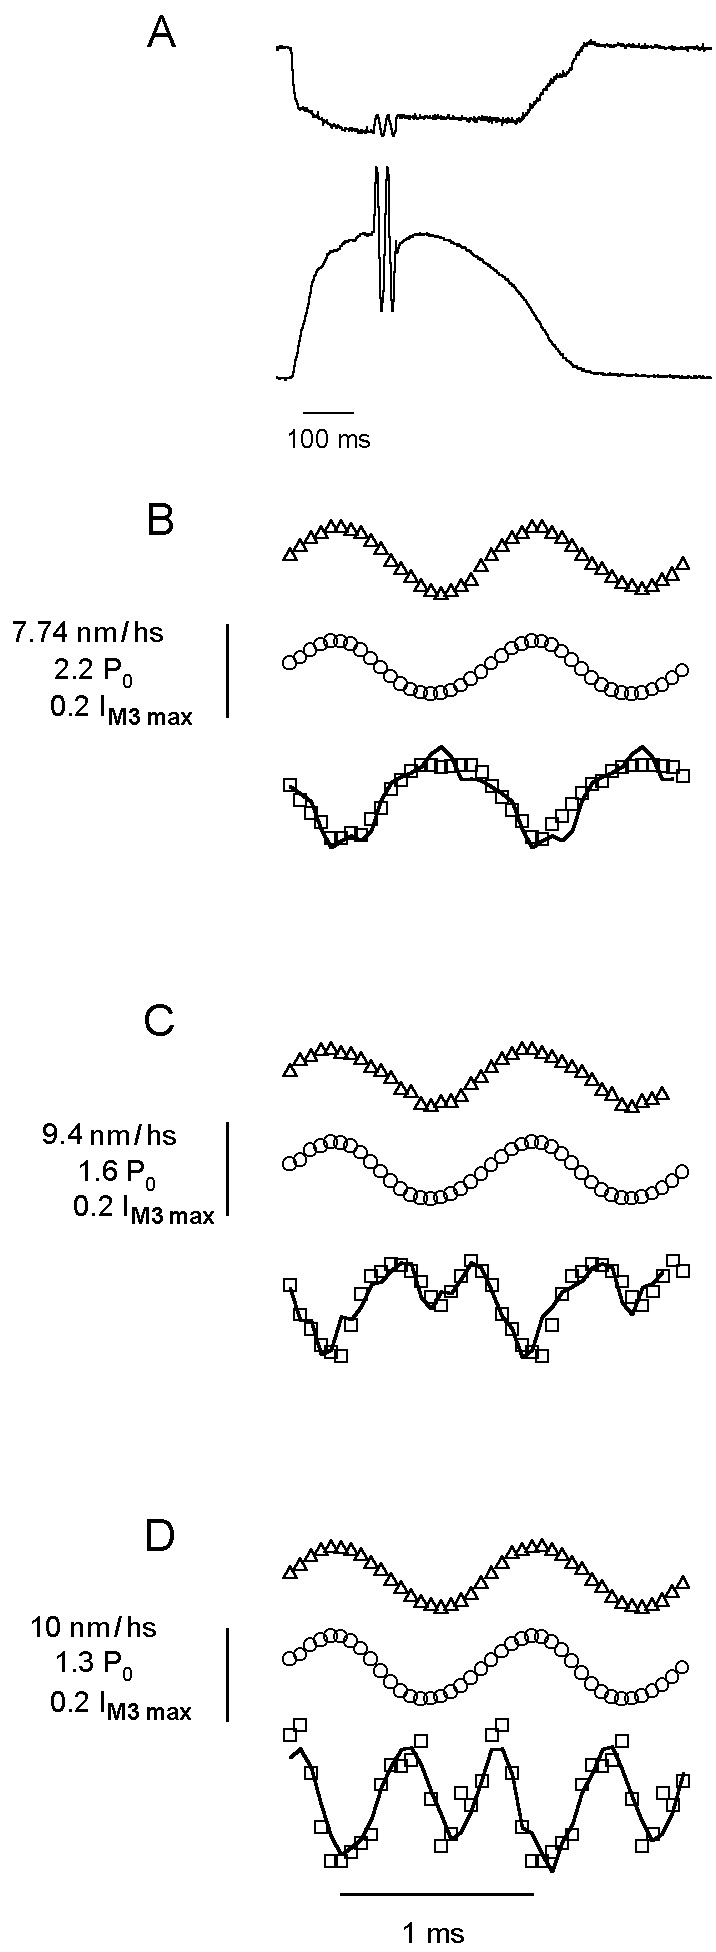
Figure 2.

Force (○), sarcomere length (▵), and IM3 (□) during 1-kHz sinusoidal length oscillations at 4 (B), 12 (C), and 18°C (D). (A) Sarcomere length (upper trace) and tetanic force with two oscillations representing the mean of all oscillations applied to the fiber (calibration bar: 5 ms for oscillations; 100 ms otherwise). The continuous line in IM3 data represents the simulated IM3 signal. Rate constants were recalculated for each t in the simulation (Eq. 1) by using kα = aα/t1/2, where t1/2 is the half time of the quick recovery to a step of amplitude l(t), obtained from t1/2(l) = 1.1775 − 0.3514l(t)+ 0.05175l(t)2 − 0.002862l(t)3 + 0.0000557l(t)4, which gave a good simulation of force responses to length steps. a values were 0.13, 0.47, 1.6, and 6.9 for components α to δ, respectively, taken from ref. 3. Similarly, the value of P2(l) was recalculated at each t as 1.003664 + 0.019303l(t) + 0.0029374l(t)2 + 0.0013382l(t)3 + 0.000062031l(t)4 − 0.003664 e0.535l(t), based on the best fit to the relation of P2(l) to l(t) for length steps.
