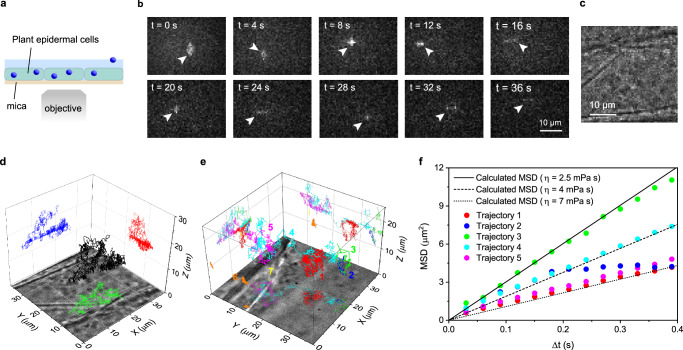
Fig. 8. Birefringence-based single-particle 3D tracking in plant cells.
a A schematic illustration of the sample configurations for the 3D tracking experiment in plant cells. This experiment was conducted using a 170 µm-thick mica substrate. b Representative time-lapse fluorescent images of 3.5 nm size fluorescent nanoparticles injected into the plant cells. A particle in the field of view is indicated by arrowheads. c A bright-field transmitted microscopy image captured at the same sample position as the fluorescence imaging experiment shown in (b). d Localized 3D diffusion trajectory of a fluorescent nanoparticle in the cell obtained from the time-lapse images in (b). e Localized 3D diffusion trajectories of multiple fluorescent nanoparticles inside the cell. f Mean square displacement (MSD) versus time lag plots obtained from the five diffusion trajectories shown in (e). The solid, dashed, and dotted lines show the theoretically calculated MSD versus time lag plots of the nanoparticles in a medium with 2.5, 4, and 7 mPa·s viscosity using the diffusion constant of the fluorescent nanoparticles estimated by Eq. 7. Three sets of samples were prepared and tested to ensure data reproducibility.

