


Abstract
Objectives
To perform a systematic review and meta-analysis and quantify the associations of total mortality with calf circumference (CC) in adults 18 years and older via combining various analyses based on empirical dichotomic CC, continuous CC, and dose-response CC.
Methods
We conducted a systematic search of relevant studies in PubMed, EMBASE, Cochrane Library, and Web of Science published through April 12, 2022. This systematic review includes longitudinal observational studies reporting the relationships of total mortality with CC. We calculated the pooled relative risk (RR) and 95% confidence interval (CI) of total mortality with CC per 1 cm for each study and combined the values using standard meta-analysis approaches. Newcastle-Ottawa scale (NOS), Grading of Recommendations, Assessment, Development and Evaluations approach (GRADE), and the Instrument for assessing the Credibility of Effect Modification Analyses (ICEMAN) were assessed for meta-analyses.
Results
Our analysis included a total of 37 cohort studies involving 62,736 participants, across which moderate heterogeneity was observed (I2=75.7%, P<0.001), but no publication bias was found. Study quality scores ranged from 6 to 9 (mean 7.7), with only three studies awarded a score of 6 (fair quality). We observed an inverse trend between total death risk and CC per 1 cm increase (RR, 0.95, 95% CI, 0.94–0.96; P<0.001; GRADE quality=high). Only a very slight difference was found among residents of nursing homes (6.9% mortality risk reduction per one cm CC increase), community-dwellers (5.4%), and those living in hospitals (4.8%), respectively (P for meta-regression=0.617). Low credible subgroup difference was found based on the ICEMAN tool.
Conclusions
Calf circumference is a valid anthropometric measure for mortality risk prediction in a community, nursing home, or hospital.
Key words: Calf circumference (CC), mortality, systematic review, meta-analysis
Introduction
As the global population continues to see a rise in its elderly demographic, more and more countries have begun to face a series of challenges inflicted by global aging, including the increased risk of malnutrition, decrease in bone and muscle mass, subsequent impairments in physical, cognitive and immune responses, as well as premature mortality (1, 2). Anthropometry is commonly used to assess nutritional conditions and health statuses in various epidemiological studies and clinical practices due to its convenience and non-invasiveness (3, 4, 5, 6). Such measurements include body mass index (BMI), waist circumstance (WC), waist-to-hip ratio (WHR), and waist-to-height ratio (WHtR), all of which can be used to assess risk of overall obesity or central obesity (7, 8, 9, 10). Two meta-analytic reviews of over 200 individual studies covering more than 30 million community-based populations have reported increased risks of total mortality in both underweight and overweight participants, with the nadir of a U-shaped dose-response curve in the BMI range set at 25 kg/m2 (11, 12). Another meta-analytic review of 72 observational studies showed that indices of central fatness (i.e. WC, WHR, and WHtR) were associated with all-cause mortality after BMI was accounted for (13). However, both overall and central obesity may present benefits to reducing the risk of death in the elderly (13, 14, 15).
Excluding indices of overall and central obesity, some extremity circumferences have been used to explain death risk, especially for the elderly and those suffering from chronic diseases, such as mid-upper arm circumference (MUAC), thigh circumference (TC), and calf circumference (CC) (16, 17, 18, 19, 20, 21, 22, 23, 24, 25). In a recent meta-analytic review, larger TC values were associated with a lower death risk, albeit only three individual studies were included in the meta-analysis for TC (13). As an indicator of reduced muscle mass and possible protein energy malnutrition (28), CC was recommended as a better indicator of health status, because the legs contain over half of the body's muscle mass (MM), which is more strongly associated with health than fat mass (FM) (26, 27).
A recent systematic meta-analytic review including 23 studies reported those with low CC having 2.42 times higher mortality risk than those with normal CC, but the meta-analysis only considered studies using varying empirical cut-offs of CC, such as 31, 33 or 34 cm (29). Furthermore, the analysis excluded several studies due to “inappropriate” rulings based on continuous CC and/or respective dose-response CC (18, 30, 31, 32, 33, 34, 35, 36, 37, 38, 39, 40, 41, 42, 43, 44). Hence, we aimed to perform an updated systematic meta-analysis of longitudinal observational studies to evaluate the associations of all-cause mortality with CC in adults aged ≥18 years old by using comprehensive methods of trend estimation from summarized dichotomic and dose-response data (45, 46, 47, 48).
Methods
Literature Searching Strategies
The reporting of this systematic review complied with the PRISMA statement guidelines (Appendix Table S1) (49). Our researchers conducted a literature search to identify longitudinal observational studies assessing the association between calf circumference and total mortality in four electronic databases, including PubMed (National Library of Medicine, National Center for Biotechnology Information, Bethesda, USA), EMBASE (Elsevier, Amsterdam, the Netherlands), Cochrane Library (John Wiley & Sons, Inc., London, United Kingdom), and Web of Science (Clarivate Analytics, Boston, USA) through April 12, 2022 (the complete search strategies for the four databases can be found in Appendix Table S2). Relevant articles utilized various combinations of relevant terms, like ([thigh circumference] OR [calf circumference] OR [extremity circumference] OR [leg circumference] OR [mid-thigh circumference] OR [knee circumference]) AND ([death] OR [mortality] OR [survival]). Duplicate publications were deleted. Each title and/or abstract was checked for relevance. The full text of an article was reviewed only if the abstract indicated that the article reported these associations. Only original studies conducted among human participants were considered for the review. Cross-referencing was employed to complement the study identification process of the systematic review.
Inclusive Criteria
Studies were included in this review if they met the following criteria: 1) adults must be 18 years or older and possess self-care abilities, such as feeding, dressing, and walking independently; 2) longitudinal observational studies, including both retrospective and prospective cohorts; 3) calf circumference had to have been measured as the maximum diameter of the calf spanning the head of the fibula and the lateral malleolus (50); thigh circumference was not considered for this review; 4) total mortality was evaluated during follow-ups on the outcome; 5) hazard ratios (HR) / relative risk (RR) / odds ratio (OR) and their corresponding confidence intervals [CI] were used to evaluate the association of total mortality with CC; 6) studies among patients suffering from debilitating diseases were not excluded, although corresponding sensitivity analyses and subgroup analyses may have been used to determine the credibility of how large an effect debilitating diseases may incur.
Data Extraction
Two researchers (Li X and Lang X) extracted the following data independently from each study in a standardized manner: 1) study characteristics: authors' names, year of publication, study duration, country of origin, number of participants, and deaths observed during the respective follow-up duration; 2) baseline demographics: mean age of participants and male proportions, mean CC and CC categorization, comorbidities, total mortality; 3) effect sizes: HR/RR/OR and their 95% CI for each CC category and/or per unit increase of CC; 4) covariates adjusted for in the analyses. Any initial disagreements were resolved by consensus after additional review of the articles or team discussions.
Quality Assessment
The two researchers, Li X and Lang X, each independently performed the quality assessment of the included studies using the Newcastle-Ottawa scale (NOS). Accounting for eight items across three domains (selection, comparability, and exposure), a study was awarded one star for each item, with the exception of the item related to comparability, which allowed the assignment of two stars. Hence, NOS ranges from 0 to 9, and a score of 7 or greater was considered good quality (51). The grading of recommendations, assessment, development and evaluations (GRADE) approach was used to rate the confidence by which increasing CC correlated with a reduced mortality risk in the broader population. After making the necessary considerations for the study design, risk of bias, imprecision, inconsistency, indirectness, and publication bias, certainty of evidence may be rated as high, moderate, low, or very low (52). Any discrepancies were discussed and resolved in our research team.
Statistical Analyses
All statistical analyses were performed with Stata 15.0. The main effect size of interest consisted the measures of the association between calf circumference and total mortality, including HR, RR, and OR. The reported ORs and HRs were first transferred to RRs before being used for final meta-analyses (47, 48). Depending on the data available, we used median, midpoints or means of various categories for transformation that we saw fit. In two studies, mortality was assessed and stratified via dose-response CC (25, 53). Due to the different categorization of CC across the studies, all results were recalculated for an increase of one centimeter CC, both within studies (taking into account any possible correlations resulting from a common reference category (45, 46)), as well as across studies.
Heterogeneity was evaluated using Cochran's Q test, and significant heterogeneity was defined as P<0.10. The heterogeneity across studies was considered to be moderate or high if the I2 statistic was greater than 50%. However, using I2 statistics to assess heterogeneity for the pooled estimate can be extremely high even in the presence of modest inconsistencies across the studies, wherein observational studies with extremely large sample sizes may result in very narrow confidence intervals. Additionally, the GRADE approach can also be used to assess heterogeneity (52). The results from both random effects models, using the DerSimonian and Laird method, and fixed effects models based on the Mantel-Haenszel methods were provided. Publication bias was evaluated using Begg and Mazumdar rank correlation tests, with significant publication bias defined as P<0.05.
We also conducted various subgroup to explore potential sources of heterogeneity and the influence of moderator variables on overall effect sizes, such as participant type (community, nursing home, hospital), publication year (≥ 2017 vs. < 2017), follow-up duration (≥ 5 years vs. <5 years), sample size (≥ 500 vs. <500), continents (Asia, America, and Europe), study quality (good vs. fair), age (≥ 65 years vs. <65 years), gender (male, female, both), average CC of targeted participants (<31 cm, ≥ 31 cm, and not available), and body position during CC measurement (standing vs. sitting). Meta-regressions were used to examine the impact of the moderator variables mentioned above on study effect sizes using regression-based techniques. The credibility of any subgroup analysis was also addressed using instrument to assess the credibility of effect modification analyses (ICEMAN) on the eight criteria (54). In order to test the robustness of overall effect sizes, one study was omitted at a time, and sensitivity analyses were performed to evaluate the influence of each individual study on the overall effect sizes. One single study was considered to have influence on the overall effect size if the point estimate of its “omitted” analysis fell outside of the 95% CI of the “combined” analysis.
Results
Study Screening and Selection
A flow diagram of the study search and selection process is presented in Figure 1. We found 827 publications via a systematic literature search, of which 352 records were deleted as duplicates. The remaining 475 titles/abstracts were screened for eligibility and 378 publications were excluded, including 239 irrelevant literature articles, 97 conference abstracts, 24 studies with participants aged <18 years old, 13 unoriginal articles, and 5 animal experiments. 97 studies appeared to be potentially relevant for inclusion, but 60 were excluded during the full-text evaluation due to the following reasons: 35 contained no CC measurements (23, 55, 56, 57, 58, 59, 60, 61, 62, 63, 64, 65, 66, 67, 68, 69, 70, 71, 72, 73, 74, 75, 76, 77, 78, 79, 80, 81, 82, 83, 84, 85, 86, 87, 88), 10 did not identify all-cause mortality as the outcome (89, 90, 91, 92, 93, 94, 95, 96, 97, 98), 8 only reported TC (99, 100, 101, 102, 103, 104, 105, 106), 5 did not report HR/RR/OR for the association between mortality and CC (107, 108, 109, 110, 111), one for including immobile patients (112), and one for being a repeated study (113), which was the same trial with one included study (30). Ultimately, thirty-seven studies met the inclusion criteria (17, 18, 19, 21, 22, 25, 30, 31, 32, 33, 34, 35, 36, 37, 38, 39, 40, 41, 42, 43, 44, 53, 114, 115, 116, 117, 118, 119, 120, 121, 122, 123, 124, 125, 126, 127, 128).
Figure 1.
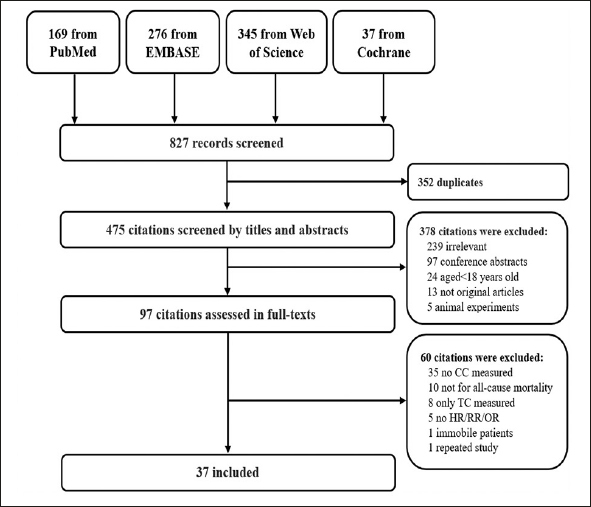
Flowchart of literature searching and study selection
Characteristics of Included Studies
Of the thirty-seven longitudinal observational studies included in this review, there were a total of 62,736 participants from three continents: sixteen in America (17, 21, 32, 33, 34, 40, 41, 42, 43, 44, 53, 121, 122, 124, 125, 127), fourteen studies in Asia (18, 19, 22, 25, 30, 31, 37, 38, 39, 115, 116, 118, 119, 120), and seven in Europe (35, 36, 114, 117, 123, 126, 128). Details on the study populations and the study results are shown in Table 1 and Appendix Table S3. Only three studies reported their effect sizes based on both continuous CC and categorical CC patterns (30, 44, 128). Six studies evaluated total death risk only with CC in the continuous pattern (17, 18, 31, 39, 114, 119), and twenty-eight studies provided results only with CC in the categorical patterns (19, 21, 22, 25, 32, 33, 34, 35, 36, 37, 38, 40, 41, 42, 43, 53, 115, 116, 117, 118, 120, 121, 122, 123, 124, 125, 126, 127), two of which were dose-response CC (25, 53). Eleven studies selected adults with no age boundaries (17, 30, 32, 34, 38, 39, 41, 44, 53, 122, 127), while other studies focused only on the elderly. Thirty-two studies provided adjusted effect sizes, but the remaining five studies did not (22, 114, 116, 117, 120) Eight studies reported long-term death risk evaluation (≥ 5 years) (17, 21, 25, 36, 40, 114, 121, 126).
Table 1.
Characteristic of included studies
| Authors[ref.], Year | Country (study duration) | male % | No. of deaths/Subjects (Mortality %) | Age (year) Mean±SD | CC (cm) Mean±SD | comorbidities at baseline | Reported effect size | Effect sizes (95% CI) | Covariates in adjusted model | Follow-up (years) |
|---|---|---|---|---|---|---|---|---|---|---|
| Mason C et al.(17), 2008 | Canada (1981–1993) | 47.1 | 571/10638(5.4) | Male: 38.0±13.2 Female: 38.5±13.3 | Male: 36.6±2.9 Female: 34.4±3.0 | NA | HR | per 1 SD increase Male: 0.78 (0.66–0.92) Female: 0.86 (0.73–1.02) | Adjusted for age, WC, BMI, smoking status, alcohol consumption, leisure-time physical activity | 13.0 |
| Wijnhoven HAH et al. (114), 2010 | Netherlands (1992–2007) | 49.6 | 1078/1667 (male: 72.5, female: 57.0) | Male: 74.7±5.7 Female: 74.1±5.9 | Male: 35.6±2.7 Female: 35.4±3.1 | NA | HR | per 1 SD decrease Male: 1.45 (1.22–1.71)a Female: 1.30 (1.15–1.48) | None | 15.0 |
| Tsai AC et al. (115), 2011 | China Taiwan (1999–2003) | 53.2 | 566/4191 (13.5) | 68.8±9.1 | Male: 34.7±3.7 Female: 32.9±3.9 | NA | HR | Age at 53–64 years CC<30/27: 2.64 (0.82–8.46) CC≥30/27: Ref. Age at 65–74 years CC<30/27: 2.59 (1.66–4.06) CC≥30/27: Ref. Age ≥ 75 years CC<30/27: 1.98 (1.52–2.58) CC≥30/27: Ref. | Adjusted for age, sex, exercise, smoking status | 4.0 |
| Lin SJ et al. (116), 2012 | China Taiwan (2008–2009) | 56.9 | 23/174(13.2) | 82.5±7.3 | 27.1±4.2 | CVD, dementia, DM, COPD, tumor, Parkinson's disease, peptic ulcer | RR | CC<31: Ref. CC≥31: 0b | None | 1.0 |
| Sharifi F et al. (18), 2012 | Iran (2006–2009) | 41.3 | 74/247 (30.0) | 76.7±8.4 | 32.7±4.2 | DM, HTN | HR | per 1 cm increase 0.92 (0.87–0.98) | Adjusted for age and sex | 3.3 |
| Tsai AC et al. (19), 2012 | China Taiwan (NA) | 100.0 | 19/160(11.9) | 81.1±NA | 28.3±4.3 | HTN, CVD, DM, dyslipidemia, respiratory disease, stroke, kidney disease, cancer, mental disorder | HR | CC<28: 3.79 (1.36–10.52) CC≥28: Ref. | Adjusted for age | 1.0 |
| Bourdel MI et al. (117), 2016 | France (2007–2012) | 52.6 | 266/606 (43.9) | >70 | NA | cancer, lymphoma | OR | CC<31:3.08 (1.69–5.61) CC≥31: Ref. | None | 2.0 |
| Ho SC et al. (118), 2016 | China Taiwan (2011–2014) | 94.2 | 22/104(21.2) | 74.2±6.9 | 32.9±3.2 | COPD | HR | CC<30:4.40 (1.82–10.63) CC≥30: Ref. | Adjusted for age, smoking status and FEV1%. | 3.0 |
| Kamiya K et al. (119), 2017 | Japan (2008–2014) | 65.4 | 72/599(12.0) | 74.8±6.3 | 31.6±3.3 | HTN, DM, dyslipidemia, prior HF | HR | per 1 SD increase 0.91 (0.56–1.47) | Adjusted for age, sex, BMI, grip strength, gait speed, eGFT, logBNP, prior HF | Median: 1.63 IQR: 2.1 |
| Wu CJ et al. (53), 2017c | USA (1999–2006) | 48.0 | NA/7629 (NA) | 49.3±18.7 | Median: 37.8 IQR: 35.3–40.6 | congestive HF, coronary heart disease, angina/angina pectoris, heart attack stroke, cancer or malignancy | HR | CC<35.3: Ref. CC35.3–37.7: 0.60 (0.47–0.77) CC37.8–40.6: 0.50 (0.37–0.67) CC>40.6: 0.43 (0.28–0.65) | Adjusted for age, sex, race, BMI, SBP, SFG, SC, SA, ALT, SUA, C-reactive protein, history of several diseases*, smoking, moderate to vigorous recreational activity | NA |
| Yajima Y et al. (120), 2017 | Japan (2014–2015) | 38.4 | 15/151 (10.7) | 82.0±9.6 | NA | NA | RR | CC<31: Ref. CC≥31: 0.59 (0.20–1.77) | None | 1.0 |
| Easton JF et al. (121), 2018 | Mexico (2001–2015) | 36.9 | 422/1298 (32.5) | 62.1±9.5 | NA | HTN, DM, cancer, lung disease, heart attack, stroke, articular disease and tuberculosis | HR | CC≤31: 1.31 (1.02–1.69) CC>31: Ref. | Adjusted for age, sex, marital status, living environment, education, smoking, physical activity, number of comorbidities | 14.0 |
| Weng CH et al. (25), 2018 | China Taiwan (2002–2009) | 42.2 | 255/329 (77.5) | 78.6±7.8 | 27.5±4.3 | HTN, DM | HR | Male/female CC<26.0/25.0: Ref. CC26.0–29.9/25.0–28.3: 0.62 (0.45–0.86) CC≥30.0/28.4: 0.51 (0.35–0.74) | Adjusted for age, sex, smoking, alcohol, betel nut, KPS, SA, HTN, DM | 7.0 |
| da Silva JR et al.(122), 2019 | Brazil (2016–2017) | 45.2 | 127/334 (38.2) | Median 63 IQR55-72 | NA | Cancer | HR | Male/female: CC≤34/33: 2.00(1.45–2.76) CC>34/33: Ref. | Adjusted for age, sex, gastrointestinal tract tumor, KPS, C-reactive protein, and Patient-Generated Subjective Global Assessment Short Form | 0.2 |
| de Almeida Roediger, M et al. (21), 2019 | Brazil (2000–2010) | 42.3 | 769/1504 (40.2) | 67.2±0.2 | 35.4±0.15 | HTN, DM, CVD, lung diseases, stroke, cancer | RR | Overall: CC<31: 1.33 (1.08–1.64) CC≥31: Ref. Male: CC<31: 1.13 (0.85–1.50) CC≥31: Ref. Female: CC<31: 1.45 (1.07–1.96) CC≥31: Ref. | Adjusted for age, sex, marital status, schooling, working status, income, weekly alcohol intake, sedentary lifestyle, smoking, HTN, DM, CVD, lung disease, stroke, cancer, number of diseases, Mini Mental State exam, and Geriatric Depression Scale | 10.0 |
| Monereo MM et al. (123), 2019 | Spain(2014-2018) | 56.7 | 16/187 (8.6) | 76.1±0.5 | Male/Female Median: 35.0/33.0 IQR: 5.0/5.0 | Acute illness or decompensation | HR | 100-day mortality for male/female: CC≤31/29: 1.88 (1.20–2.98) CC>31/29: Ref. | Adjusted for sex, and comorbidity | 0.3 |
| Rodrigues J et al. (124), 2019 | Brazil (2010–2014) | 65.0 | 61/173 (35.2) | Median: 69.4 Range: 64.5–75.4 | 34.1±3.8 | Patients undergoing maintenance hemodialysis | HR | CC<31: 2.27 (1.27–4.05) CC≥31: Ref. | Adjusted for sex, age, dialysis vintage, and presence of DM | 2.0 |
| Yang M et al. (31), 2019 | China (2016) | 31.9 | 73/329 (22.2) | Median: 85.0 IQR: 3.0 | Male: 33.0±4.0 Female: 32.0±3.0 | HTN, ischemic heart disease, chronic HF COPD, DM, stroke, cancer, osteoarthritis, Parkinson disease, cognitive impairment, depression | HR | per 1 cm increase 1.60 (0.96–2.66) | Adjusted for age, gender, ischemic heart disease, Parkinson disease, malnutrition risk or malnutrition and BMI | 1.0 |
| Aliberti MJR et al. (125), 2020 | Brazil (2014–2017) | 36.7 | 90/665 (13.5) | 78.7±8.3 | NA | infectious diseases, acute anemia, uncontrolled HTN, decompensated DM, symptomatic congestive HF, refractory pain | HR | Male/female: CC≤34/33: 1.22 (0.74–1.99) CC>34/33: Ref. | Adjusted for age, sex, race, income, Charlson comorbidity index, depressive symptoms, cognitive impairment, and unintentional weight loss. | 1.0 |
| de Sousa OV et al. (126), 2020 | Portugal (2012–2017) | 40.0 | 22/79 (27.8) | Median: 79 IQR: 28 | NA | Alzheimer's disease | HR | CC≤31: 4.27 (1.63–11.16) CC>31: Ref. | Adjusted for sex, age, marital status, education, Mini Mental State Examination | 5.0 |
| Moon S et al. (22), 2020 | Korea (2011–2013) | 26.4 | 94/276 (34.1) | 80.5±7.1 | 27.6±3.8 | HTN, DM, heart disease, chronic respiratory disease, urinary incontinence | OR | CC<28: 2.01 (1.21,3.34) CC≥28: Ref. | None | 2.0 |
| Sousa IM et al. (34), 2020 | Brazil (2017–2019) | 47.2 | 40/250 (16.0) | Median: 63 Range: 55–73 | NA | cancer | HR | Male/female: CC≤34/33: 3.01 (1.52–5.98) CC>34/33: Ref. | Adjusted for age, sex, and stage of disease | 1.0 |
| Tarnowski M et al. (127), 2020 | Brazil (2013–2015) | 45.4 | 20/528 (3.9) | 52.8 ± 16.2 | Male: 36.7±12.9 Female: 35.7±5.3 | gastroenterological disorders, cancer and related complications, cardiac diseases, and neurologic diseases | HR | Male/female: CC<34/33: 2.02 (0.76–5.36) CC≥34/33: Ref. | Adjusted for age and stress of diseases | Median: 9.0 days IQR: 3.0–19.0 days |
| Valmorbida E et al. (128), 2020 | Italy (2015–2017) | 28.5 | 52/144 (36.1) | Median: 86 IQR: 82–91 | Median: 30.8 IQR: 28.0–33.0 | DM, cardiovascular disease, HTN, stroke, pressure ulcers, dementia, cancer | HR | per 1 cm decrease 1.16 (1.07–1.26) CC<31: 3.39 (1.80–6.39) CC≥31: Ref. | Adjusted for age, sex, DM, CVD, stroke, cancer, recent hip fracture, number of drugs used, Short Portable Mental Status Questionnaire | 1.5 |
| Abreo AP et al. (44), 2021 | US (1999–2004) | 50.2 | 748/11871 (6.3) | 50.5±18.5 | 38.2±4.4 | coronary artery disease, HF, stroke, DM, history of malignancy, HTN, emphysema | HR | per 1 cm increase Male: 0.92 (0.88–0.96) Female: 0.88 (0.84–0.92) Male: CC<34: 3.15 (2.54–3.89) CC≥34: Ref Female: CC<33: 3.52 (2.76–4.50) CC≥33: Ref. | Adjusted for age, race, coronary artery disease, HF, stroke, DM, history of malignancy, HTN, emphysema, kidney disease, BMI, WC, SAe | 4.7 |
| Dos Santos RCO et al. (41), 2021 | Brazil (2018–2019) | 51.4 | 47/601 (7.8) | 55.7±14.8 | 36.5±4.3 | Cancer, CVD and pulmonary disease | OR | Male/female: CC≤34/33: 2.49 (1.27–4.85) CC>34/33: Ref. | Adjusted for White ethnicity and Charlson comorbidity index | 0.5 |
| Fernandes DPS et al. (40), 2021 | Brazil (2009–2018) | 46.6 | 197/736 (26.8) | Median: 70 IQR: 64–77 | Median: 35.6 IQR: 33.1–38.2 | NA | HR | CC<34.5: 2.36 (1.51–3.68) CC≥34.5: Ref. CC<31: 2.56 (1.47–4.49) CC≥31: Ref. | Adjusted for sex, age, education, quality of diet, physical activity, smoking and BMI | 9.0 |
| Ge YZ et al. (39), 2021 | China (2013–2020) | NA | NA/524 (NA) | >18 | 31.4±3.6 | cancer cachexia | OR | per 1 cm decrease 0.95 (0.90–1.01) | Adjusted for EORTC QLQ-C30, albumin, neutrophils, erythrocyte, chronic disease and family history of cancer | 1.0 |
| Nishikawa H et al (38), 2021 | Japan (2013–2020) | 49.0 | 64/631 (10.1) | Median: 65 IQR: 52–71 | Male/Female Median: 37.3/34.7 IQR:4.6/4.5 | Liver diseases | HR | Male/female: CC≤34/33: 5.03 (2.62–9.84) CC>34/33: Ref. | Adjusted for age, sex, presence of liver cirrhosis, presence of hepatocellular carcinoma, grip strength, skeletal muscle index, SA, platelet count, prothrombin time, aspartate aminotransferase, eGFR, cause | 3.5 |
| Sanchez RD et al (36), 2021 | Belgium (2013–2019) | 44.0 | 52/373 (13.9) | 73.1±6.0 | NA | NA | HR | CC<31: 3.35 (1.85–6.07) CC≥31: Ref. | Adjusted for age, sex, number of concomitant diseases, number of drugs, physical activity level, and cognitive status | 5.0 |
| Sobestiansky S et al. (35), 2021 | Sweden (2009–2010) | 32.1 | 26/56 (46.4) | 84.1±7.3 | 33.8±4.4 | HF, MI, arrhythmia, peripheral vascular disease, DM, COPD, rheumatic disease, CVD, cognitive disease, depression, cancer, osteoporosis, fracture | HR | CC<31: 1.99 (0.82–4.82) CC≥31: Ref. | Adjusted for age and Charlson comorbidity index | 2.0 |
| Teixeira PP et al.(33), 2021 | Brazil (2019–2020) | 43.8 | 16/176 (9.1) | 68.2±10.4 | 31.7±3.7 | COPD | HR | Male/female: CC≤34/33: 1.20 (0.25–5.67) CC>34/33: Ref. | Adjusted for modified Medical Research Council Scale and age | NA |
| Yin L et al. (30), 2021 | China (2012–2019) | 52.7 | 2751/12138 (22.7) | 56.9±11.6 | 33.1±3.8 | Cancer, HTN, DM, coronary heart disease, anemia | HR | per 1 sd increase 0.94 (0.90–0.98) Male/female: CC<32.8/30.0: 1.13 (1.03–1.23) CC≥32.8/30.0: Ref | Adjusted for age, sex, drinking, tumor stage, cancer site, differentiation grade, radical surgery, chemotherapy, hospitalization duration, prealbumin, NRS2002 score, global quality of life score, KPS score, TSF | 2.8 |
| Bernardes S et al. (43), 2022 | Brazil (2002–2009) | 65.3 | 18/144 (12.5) | 64.6±8.5 | 34.4±3.7 | COPD | OR | Male/female: CC≤34/33: 3.69 (1.06–12.87) CC>34/33: Ref. | Adjusted for age, smoking status, and forced expiratory volume in 1 s | 2.0 |
| de Sousa IM et al. (42), 2022 | Brazil (2017–2019) | 50.6 | 46/178 (25.8) | 60.8±12.6 | NA | gastric and colorectal cancer | HR | Male/female: CC<34/33: 2.40 (1.10–5.20) CC≥34/33: Ref | adjusted for age, TNM stage, type of treatment, and site of cancer | 1.0 |
| Ren C et al. (37), 2022 | China (2017–2018) | 71.6 | 105/514 (20.4) | 86.5±6.0 | NA | Cerebral infraction, coronary heart disease, DM, HTN | HR | CC<28.8: 2.78 (1.27–5.98) CC≥28.8: Ref | Adjusted for fasting plasma glucose, hemoglobin and nutritional risk | 2.0 |
| Wu SE et al.(32), 2022 | US (1999–2002) | 51.7 | NA/2532 (NA) | Range: 50–85 | 34.4±3.7 | Arthritis, congestive HF, coronary heart disease, angina pectoris, heart attack, stroke, emphysema | HR | Male/female: CC<34/33: 1.55 (0.70–3.42) CC≥34/33: Ref | Adjusted for age, sex, race, smoking, comorbidity, education level, BMI | NA |
Abbreviation: SD, standard deviance; CC, calf circumference; HR, hazard ratio; CI, confidence interval; NA, not available; WC, waist circumference; BMI, body mass index; SBP, systolic blood pressure; eGFT, estimated glomerular filtration rate; logBNP, logarithm for B-type natriuretic peptide; IQR, interquartile range; HF, heart failure; SFG, serum fasting glucose; SC, serum cholesterol; SA, serum albumin; ALT, alanine aminotransferase; SUA, serum uric acid; HTN, hypertension; DM, diabetes mellitus; CVD, cardiovascular diseases; EORTCQLQ-C30, The European Organization for Research and Treatment of Cancer QLQ-C30; MI, myocardial infarction; TSF, triceps skinfold thickness; KPS, Karnofsky Performance Status score; a. Only males with CC<37.6 cm were evaluated; b.0 died in those with CC≥31 cm; c. Detailed information about mortality dates were obtained from the National Center for Health Statistics of the Centers for Disease Control and Prevention (CDC) in USA, or censored at December 31, 2006; d. History of several diseases included congestive heart failure, coronary heart diseases, angina/angina pectoris, heart attack, stroke, cancer; e. Adjusted covariates for continuous CC.
Study Quality and Certainty Assessment
Study quality scores ranged from 6 to 9 (mean 7.7), with nine studies having a full score of 9 (21, 30, 31, 36, 39, 40, 44, 115, 121). Only three studies were awarded the status of fair quality (19, 33, 114), whereas the other studies were rated as good quality (Table 2). The certainty for estimate of mortality was high, and more detailed GRADE assessments can be found in Appendix Table S4.
Table 2.
Assessment of risk of bias of the studies included
| Authors (ref.), Year | Selection | Comparability | Outcome | Overall Score* | |||||
|---|---|---|---|---|---|---|---|---|---|
| Representativeness of the exposed cohort | Selection of the non-exposed cohort | Assessment of exposure | Demonstration that outcome of interest was not present at start of study | Comparability of cohorts on the basis of the design or analysis | Ascertainment of outcome | Long enough follow-up for outcomes to occur | Adequacy of follow-up of cohorts | ||
| Mason C et al. (17), 2008 | * | * | * | * | ** | * | * | - | 8 |
| Wijnhoven HAH et al. (114), 2010 | * | * | * | * | - | * | * | - | 6 |
| Tsai AC et al. (115), 2011 | * | * | * | * | ** | * | * | * | 9 |
| Lin SJ et al. (116), 2012 | - | * | * | * | * | * | * | * | 7 |
| Sharifi F et al. (18), 2012 | * | * | * | * | ** | * | - | * | 8 |
| Tsai AC et al. (19), 2012 | - | * | * | * | * | * | * | - | 6 |
| Bourdel MI et al. (117), 2016 | * | * | * | * | - | * | * | * | 7 |
| Ho SC et al. (118), 2016 | - | * | * | * | * | * | * | * | 7 |
| Kamiya K et al. (119), 2017 | - | * | * | * | ** | * | * | - | 7 |
| Wu CJ et al.(53), 2017c | * | * | * | * | ** | * | * | - | 8 |
| Yajima Y et al.(120), 2017 | - | * | * | * | * | * | * | * | 7 |
| Easton JF et al. (121), 2018 | * | * | * | * | ** | * | * | * | 9 |
| Weng CH et al. (25), 2018 | - | * | * | * | ** | * | * | * | 8 |
| da Silva JR et al. (122), 2019 | - | * | * | * | ** | * | - | * | 7 |
| de Almeida Roediger, M et al. (21), 2019 | * | * | * | * | ** | * | * | * | 9 |
| Monereo MM et al. (123), 2019 | - | * | * | * | ** | * | - | * | 7 |
| Rodrigues J et al. (124), 2019 | - | * | * | * | ** | * | * | * | 8 |
| Yang M et al. (31), 2019 | * | * | * | * | ** | * | * | * | 9 |
| Aliberti MJR et al. (125), 2020 | - | * | * | * | ** | * | * | * | 8 |
| de Sousa OV et al. (126), 2020 | - | * | * | * | ** | * | * | * | 8 |
| Moon S et al. (22), 2020 | * | * | * | * | * | * | * | * | 8 |
| Sousa IM et al. (34), 2020 | - | * | * | * | ** | * | * | * | 8 |
| Tarnowski M et al. (127), 2020 | - | * | * | * | ** | * | - | * | 7 |
| Valmorbida E et al. (128), 2020 | - | * | * | * | ** | * | * | - | 7 |
| Abreo AP et al.(44), 2021 | * | * | * | * | ** | * | * | * | 9 |
| Dos Santos RCO et al.(41), 2021 | * | * | * | * | * | * | - | * | 7 |
| Fernandes DPS et al. (40), 2021 | * | * | * | * | ** | * | * | * | 9 |
| Ge YZ et al. (39), 2021 | * | * | * | * | ** | * | * | * | 9 |
| Nishikawa H et al. (38), 2021 | - | * | * | * | ** | * | * | * | 8 |
| Sanchez RD et al.(36), 2021 | * | * | * | * | ** | * | * | * | 9 |
| Sobestiansky S et al. (35), 2021 | - | * | * | * | * | * | * | * | 7 |
| Teixeira PP et al. (33), 2021 | - | * | * | * | * | * | - | * | 6 |
| Yin L et al. (30), 2021 | * | * | * | * | ** | * | * | * | 9 |
| Bernardes S et al. (43), 2022 | - | * | * | * | * | * | * | * | 7 |
| de Sousa IM et al. (42), 2022 | - | * | * | * | * | * | * | * | 7 |
| Ren C et al. (37), 2022 | - | * | * | * | * | * | * | * | 7 |
| Wu SE et al. (32), 2022 | * | * | * | * | ** | * | - | * | 8 |
Abbreviation: “-” =criteria not met; “*”=one point for meeting criteria; “**”=two points for meeting criteria; * Overall score: 0–3 points = “poor quality”; 4–6 points = “fair quality”; 7–9 points = “good quality”
Meta-analyses for Effect Sizes
Figure 2 illustrates the forest plot of the pooled RR values for all-cause mortality per one cm CC, and further subgroup analyses results are also shown for the various participant types, including community, nursing home, and hospital. Among the thirty-seven studies that met the inclusion criteria (17, 18, 19, 21, 22, 25, 30, 31, 32, 33, 34, 35, 36, 37, 38, 39, 40, 41, 42, 43, 44, 53, 114, 115, 116, 117, 118, 119, 120, 121, 122, 123, 124, 125, 126, 127, 128), two were not included in the meta-analysis for the following reasons: one study among 174 elderly reported that nobody died in those with CC≥ 31 cm (116), while the other study didn't report the mortality so the OR could not be converted to RR (39). A significant association was observed in the pooled analyses using either the fixed effects model (RR, 0.967; 95% CI, 0.963–0.971; P<0.01) or the random effects model (RR, 0.947; 95% CI, 0.937–0.958; P<0.01). No significant difference was detected for those living in communities, nursing homes, or hospitals (P=0.617). Significant heterogeneity was observed across thirty-five individual studies (I2=75.7%, P<0.01), but no publication bias was found (P=0.20). We also performed sensitivity analyses to evaluate the stability of overall effect size and detected no outliers (Appendix Figure S1).
Figure 2.
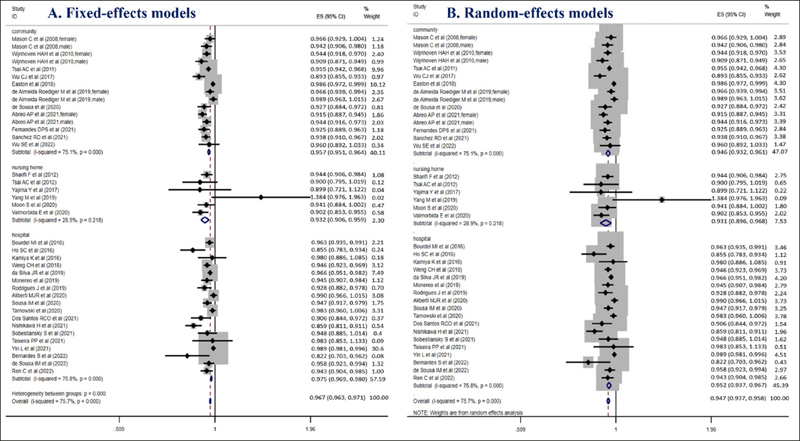
Forest plots for pooled associations between total death and CC (A) Fixed-effects model; (B) Random-effects model
Subgroup analyses
In subgroup analyses, we found statistical significance in most subgroups, except for lying during CC measurements (RR, 1.10; 95% CI, 0.77–1.58; P=0.607). However, only two studies reported this measurement when lying (31, 35) (Table 3). There was a low credible subgroup difference based on the eight criteria introduced by the ICEMAN tool (Appendix Table S5).
Table 3.
The results of subgroup analyses and meta-regression for the associations of all-cause mortality per one cm increase
| Moderators | No. of studies | Subgroup analyses | Heterogeneity | Meta-regression | Publication bias (Begg's test) | ||||
|---|---|---|---|---|---|---|---|---|---|
| Fixed effect models | Random effect models | ||||||||
| RR (95% CI) | P value | RR (95% CI) | P value | I2 | P value | P value | P value | ||
| All study combined | 35 | 0.967 (0.963–0.971) | <0.001 | 0.947 (0.937–0.958) | <0.001 | 75.7% | <0.001 | 0.200 | |
| Publication year | 0.632 | ||||||||
| < 2017 | 8 | 0.950 (0.941–0.959) | <0.001 | 0.947 (0.933–0.960) | <0.001 | 31.3% | 0.158 | 0.074 | |
| ≥ 2017 | 27 | 0.971 (0.966–0.976) | <0.001 | 0.949 (0.936–0.961) | <0.001 | 78.1% | <0.001 | 0.253 | |
| Follow up duration (years) | 0.806 | ||||||||
| < 5 | 24 | 0.969 (0.964–0.974) | <0.001 | 0.947 (0.933–0.960) | <0.001 | 77.1% | <0.001 | 0.414 | |
| ≥ 5 | 8 | 0.963 (0.955–0.971) | <0.001 | 0.952 (0.936–0.968) | <0.001 | 72.7% | <0.001 | 0.043 | |
| NA | 3 | 0.915 (0.882–0.948) | <0.001 | 0.928 (0.874–0.986) | 0.015 | 47.5% | 0.149 | 1.000 | |
| Sample size | 0.249 | ||||||||
| < 500 | 18 | 0.949 (0.940–0.958) | <0.001 | 0.942 (0.930–0.955) | <0.001 | 32.2% | 0.093 | 0.405 | |
| ≥ 500 | 17 | 0.972 (0.967–0.976) | <0.001 | 0.952 (0.939–0.965) | <0.001 | 82.1% | <0.001 | 0.024 | |
| Continents | 0.782 | ||||||||
| Asia | 12 | 0.974 (0.968–0.980) | <0.001 | 0.941 (0.918–0.965) | <0.001 | 83.2% | <0.001 | 0.150 | |
| America | 17 | 0.965 (0.959–0.971) | <0.001 | 0.953 (0.940–0.966) | <0.001 | 70.1% | <0.001 | 0.010 | |
| Europe | 6 | 0.941 (0.928–0.954) | <0.001 | 0.940 (0.926–0.955) | <0.001 | 15.6% | 0.311 | 0.368 | |
| Study quality-NOS | 0.364 | ||||||||
| Fair (4–6 stars) | 3 | 0.934 (0.913–0.955) | <0.001 | 0.934 (0.913–0.955) | <0.001 | 0.0% | 0.408 | 1.000 | |
| Good (7–9 stars) | 32 | 0.968 (0.964–0.972) | <0.001 | 0.949 (0.930–0.960) | <0.001 | 76.4% | <0.001 | 0.112 | |
| Age (years) | 0.869 | ||||||||
| < 65 | 10 | 0.977 (0.972–0.983) | <0.001 | 0.951 (0.933–0.969) | <0.001 | 83.3% | <0.001 | 0.064 | |
| ≥ 65 | 23 | 0.952 (0.945–0.958) | <0.001 | 0.944 (0.932–0.956) | <0.001 | 58.1% | 0.079 | 0.272 | |
| NA | 2 | 0.966 (0.951–0.981) | <0.001 | 0.966 (0.951–0.981) | <0.001 | 0.0% | 0.860 | 1.000 | |
| Gender | 0.975 | ||||||||
| Male | 4 | 0.956 (0.940–0.971) | <0.001 | 0.948 (0.915–0.982) | 0.003 | 76.4% | 0.005 | 0.308 | |
| Female | 4 | 0.947 (0.933–0.962) | <0.001 | 0.947 (0.924–0.971) | <0.001 | 60.1% | 0.057 | 1.000 | |
| Both | 31 | 0.969 (0.965–0.974) | <0.001 | 0.947 (0.936–0.959) | <0.001 | 76.1% | <0.001 | 0.518 | |
| Average CC of participants (cm) | 0.104 | ||||||||
| < 31 | 4 | 0.938 (0.919–0.958) | <0.001 | 0.938 (0.919–0.958) | <0.001 | 0.0% | 0.438 | 0.734 | |
| ≥ 31 | 21 | 0.967 (0.962–0.972) | <0.001 | 0.942 (0.928–0.957) | <0.001 | 80.6% | <0.001 | 0.657 | |
| NA | 10 | 0.970 (0.962–0.977) | <0.001 | 0.962 (0.949–0.976) | <0.001 | 57.7% | 0.011 | 0.409 | |
| Position during CC measurements | 0.088 | ||||||||
| Standing | 5 | 0.943 (0.930–0.956) | <0.001 | 0.943 (0.930–0.956) | <0.001 | 0.0% | 0.565 | 0.072 | |
| Sitting | 18 | 0.970 (0.964–0.975) | <0.001 | 0.936 (0.918–0.954) | <0.001 | 83.8% | <0.001 | 0.327 | |
| Lying | 2 | 0.961 (0.899–1.027) | 0.240 | 1.100 (0.765–1.581) | 0.607 | 77.0% | 0.037 | 1.000 | |
| NA | 10 | 0.969 (0.962–0.976) | <0.001 | 0.966 (0.954–0.978) | <0.001 | 53.2% | 0.019 | 0.119 | |
| Adjusted effect sizes used | 0.627 | ||||||||
| Yes | 31 | 0.968 (0.964–0.973) | <0.001 | 0.948 (0.938–0.959) | <0.001 | 77.1% | <0.001 | 0.236 | |
| No | 4 | 0.944 (0.928–0.961) | <0.001 | 0.943 (0.924–0.963) | <0.001 | 18.0% | 0.300 | 0.462 | |
| BMI adjusted effect sizes used | 0.292 | ||||||||
| Yes | 7 | 0.935 (0.921–0.948) | <0.001 | 0.937 (0.916–0.957) | <0.001 | 49.0% | 0.047 | 0.348 | |
| No | 24 | 0.972 (0.967–0.976) | <0.001 | 0.953 (0.941–0.965) | <0.001 | 76.5% | <0.001 | 0.027 | |
Note: CC, calf circumference; RR, relative risk; CI, confidence interval; NOS, Newcastle-Ottawa scale; NA, not available
Discussions
To our knowledge, this is the most comprehensive systematic review and meta-analysis so far that summarizes the results of thirty-seven longitudinal observational studies adding up to a total of 62,736 subjects to evaluate the association of all-cause mortality with calf circumference by combining various original analyses based on empirical dichotomic CC, continuous CC, and dose-response CC. Due to heterogeneous CC patterns from various studies, effect sizes in categorical CC were transcribed into ones in the continuous pattern. 5% death risk reduction was found per one cm CC increase from the included studies, albeit 75.7% heterogeneity was found. Thus, because using I2 statistics to assess heterogeneity in observational studies is problematic in the context of precise estimates and large sample sizes (17, 30, 44, 53), we assess the certainty of our meta-analysis using the GRADE approach as a high quality and critically important feature from the study design, risk of bias, imprecision, inconsistency, indirectness, and publication bias.
This updated review confirms and extends the results from the included studies by a comprehensive trend analysis of adjusted risk ratio over the entire range of CC levels, both within and across studies. A systematic meta-analytic review including 23 studies was published very recently and provided the overall hazard ratio (HR) and 95% confidence interval for dichotomous variables, reporting that those with low CC had a 2.42 times higher mortality risk than those with normal CC (29). However, only studies using specific empirical cut-offs of CC value were considered in their meta-analyses, and some studies were left out due to “inappropriate” analyses based on continuous CC and/or respective dose-response CC (18, 30, 31, 32, 33, 34, 35, 36, 37, 38, 39, 40, 41, 42, 43, 44). A 1 cm increase in CC results in a 5% reduction in mortality rate. When one CC unit is increased to 3 cm, 4 cm, and 5 cm, the corresponding reductions in mortality rate are 15%, 19%, and 24%, respectively. Early warning signs of dangerous calf circumferences should be explored for death risks in the context of additional longitudinal studies and in-depth analyses, which could help further our understanding of the role that calf circumference plays on predicting death in various ethnic groups.
Sarcopenia is a condition related to aging and is associated with decreased activity owing to reduced skeletal muscle mass (129, 130, 131, 132, 133). Although diagnostic imaging approaches have been recommended to measure muscle mass, including computed tomography (CT), magnetic resonance imaging (MRI), and dual energy X-ray absorptiometry (DXA), their large-scale application into communities or epidemiological research studies is restricted due to radiation exposure risks, the need for skilled technicians, time-consuming procedures, and expensive costs (131, 132, 134, 135, 136, 137). Therefore, a simpler method is needed for assessing muscle mass than diagnostic imaging. Compared to other anthropometric parameters, CC was observed to be most associated with muscle mass and malnutrition, because of the greater lean mass in the calves (17, 126, 138, 139). The systematic reviews and meta-analyses conducted here provide further evidence that CC is inversely related to total mortality, especially in elderly populations, though only few available studies focused on those with ages of 18–65 years (17, 30, 32, 41, 44, 53, 127).
As proposed by a recent study using a diverse population sample, using BMI-adjusted CC could help to remove the confounding effects of obesity and thereby improve CC as a useful practical estimate of skeletal muscle mass (140). As we know, CC values are much higher in overweight/obese populations, while smaller in those with extremely low BMI, regardless of age, ethnicity, or race. In other words, obesity may be considered as one moderating effect on CC diagnostic performance for muscle mass (141, 142). Among the thirty-seven included studies, however, only seven studies provided BMI as one covariate in their multivariate analyses (17, 31, 32, 40, 44, 53, 119). Further subgroup analyses and meta-regression failed to find significant variations between BMI-adjusted effect sizes and unadjusted ones. Nevertheless, more studies should be conducted to consider the influence of obesity may have when developing early warning values of CC for death risk predictions.
The first study regarding the association of mortality with CC reported that CC had a significantly protective effect in men, but not for women (17), but this result contrasted with the results of another American study (21). The remaining studies in our review did not present their respective results in women and men (18, 19, 22, 25, 30, 31, 32, 33, 34, 35, 36, 37, 38, 39, 40, 41, 42, 43, 53, 115, 116, 117, 118, 119, 120, 121, 122, 123, 124, 125, 126, 127, 128), though sex-specific cut-off points of CC were applied in the analyses of fourteen studies (25, 30, 32, 33, 34, 38, 41, 42, 43, 115, 122, 123, 125, 127). We obtained marginally significant results in our subgroup analyses in continuous CC (per one cm increase of CC) after merging sex-separated effect sizes in these three studies (17, 21, 44, 114). Therefore, no sufficient evidence can be used to resolve the inconsistent results in women and men thus far.
A major strength of our study is the application of advanced techniques of statistical analyses that allowed us to summarize adjusted associations across studies and over the entire range of CC values, despite the very heterogeneous categorization of CC in the individual studies. Nonetheless, some important limitations must be noted when interpreting these results. Firstly, as the original data in individuals were not available from eligible articles, the risk estimation may be less accurate based on reported effect sizes, especially when the effect sizes were transferred into RR per one cm CC increase from odds ratio or hazard ratio. Secondly, various potentially influential covariates were used for adjustments in the original analyses, which may influence the overall effect sizes in the metaanalysis. Moreover, some studies included in our meta-analysis did not provide adjusted effect sizes (22, 114, 117, 120), though no significant variation was detected in subgroup analyses and meta-regression between adjusted and unadjusted effect sizes. Thirdly, since subgroup data was obtained from the original articles, some studies were not included in our subgroup analyses if no follow-up duration was reported (32, 33, 53) and no age subgroup of the participants was provided (32, 120, 121, 122, 126). Finally, although our systematic review searched four databases and extensive checks for completeness by cross-referencing was employed, we could not exclude missed studies of relevance.
Conclusions
Despite these limitations, we provided the most comprehensive empirical evidence to date that adequate CC is inversely related to all-cause mortality risk and the certainty for the result possesses high quality based on the GRADE approach. However, in-depth analyses of the assessed associations in the context of additional longitudinal studies are highly desirable to enable more precise estimates and a better understanding of the role of calf circumference in mortality prediction abilities, especially for adults of 18–65 years of age. Further international studies are also needed for the optimal cutoff points of calf circumference.
Contributor Information
Lu Yin, Email: yinlu@fuwai.com.
Xiaomei Liu, Email: liuliumei@hotmail.com.
Conflict of interest
No.
Electronic Supplementary Material
Supplementary material is available for this article at https://doi.org/10.1007/s12603-022-1838-0 and is accessible for authorized users.
Supplementary material, approximately 341 KB.
References
- 1.Wickramasinghe K, Mathers JC, Wopereis S, et al. From lifespan to healthspan: the role of nutrition in healthy ageing. J Nutr Sci. 2020;9:e33. doi: 10.1017/jns.2020.26. 10.1017/jns.2020.26 PubMed PMID: 33101660, PMCID 7550962. [DOI] [PMC free article] [PubMed] [Google Scholar]
- 2.World Health Organization. Ageing and health. https://www.who.int/news-room/fact-sheets/detail/ageing-and-health [updated 5 February 2018].
- 3.Hermans K, van den Brandt PA, Loef C, et al. Anthropometry, physical activity and cancer of unknown primary (CUP) risk: Results from the Netherlands cohort study. Cancer Epidemiol. 2020;69:101836. doi: 10.1016/j.canep.2020.101836. 10.1016/j.canep.2020.101836 PubMed PMID: 33099214. [DOI] [PubMed] [Google Scholar]
- 4.Poon ET, Little JP, Sit CH, et al. The effect of low-volume high-intensity interval training on cardiometabolic health and psychological responses in overweight/obese middle-aged men. J Sports Sci. 2020;38(17):1997–2004. doi: 10.1080/02640414.2020.1766178. 10.1080/02640414.2020.1766178 PubMed PMID: 32497454. [DOI] [PubMed] [Google Scholar]
- 5.Yaprak DS, Yalçın B, Pınar AA, et al. Assessment of nutritional status in children with cancer: Significance of arm anthropometry and serum visceral proteins. Pediatr Blood Cancer. 2020:e28752. doi: 10.1002/pbc.28752. [DOI] [PubMed]
- 6.Yasuoka J, Yi S, Okawa S, et al. Nutritional status and dietary diversity of school-age children living with HIV: a cross-sectional study in Phnom Penh, Cambodia. BMC Public Health. 2020;20(1):1181. doi: 10.1186/s12889-020-09238-8. 10.1186/s12889-020-09238-8 PubMed PMID: 32727433, PMCID 7388459. [DOI] [PMC free article] [PubMed] [Google Scholar]
- 7.Brand C, Reuter CP, Gaya AR, et al. Association between cardiorespiratory fitness and cardiometabolic risk factors in Brazilianchildren and adolescents: the mediating role of obesity parameters. Paediatr Int Child Health. 2020:1–10. doi: 10.1080/20469047.2020.1838758. [DOI] [PubMed]
- 8.Lee MR, Jung SM, Kim HS, et al. Association of muscle strength with cardiovascular risk in Korean adults: Findings from the Korea National Health and Nutrition Examination Survey (KNHANES) VI to VII (2014–2016) Medicine (Baltimore) 2018;97(47):e13240. doi: 10.1097/MD.0000000000013240. 10.1097/MD.0000000000013240 [DOI] [PMC free article] [PubMed] [Google Scholar]
- 9.Rossello X, Fuster V, Oliva B, et al. Association Between Body Size Phenotypes and Subclinical Atherosclerosis. J Clin Endocrinol Metab. 2020;105(12) doi: 10.1210/clinem/dgaa620. 10.1210/clinem/dgaa620 [DOI] [PMC free article] [PubMed] [Google Scholar]
- 10.Zhu P, Herrington WG, Haynes R, et al. Conventional and Genetic Evidence on the Association between Adiposity and CKD. J Am Soc Nephrol. 2020. doi: 10.1681/asn.2020050679. [DOI] [PMC free article] [PubMed]
- 11.Aune D, Sen A, Prasad M, et al. BMI and all cause mortality: systematic review and non-linear dose-response meta-analysis of 230 cohort studies with 3.74 million deaths among 30.3 million participants. BMJ. 2016;353:i2156. doi: 10.1136/bmj.i2156. 10.1136/bmj.i2156 PubMed PMID: 27146380, PMCID 4856854. [DOI] [PMC free article] [PubMed] [Google Scholar]
- 12.Global BMIMC, Di Angelantonio E, Bhupathiraju S N, et al. Body-mass index and all-cause mortality: individual-participant-data meta-analysis of 239 prospective studies in four continents. Lancet. 2016;388(10046):776–786. doi: 10.1016/S0140-6736(16)30175-1. 10.1016/S0140-6736(16)30175-1 [DOI] [PMC free article] [PubMed] [Google Scholar]
- 13.Jayedi A, Soltani S, Zargar MS, et al. Central fatness and risk of all cause mortality: systematic review and dose-response meta-analysis of 72 prospective cohort studies. BMJ. 2020;370:m3324. doi: 10.1136/bmj.m3324. 10.1136/bmj.m3324 PubMed PMID: 32967840, PMCID 7509947. [DOI] [PMC free article] [PubMed] [Google Scholar]
- 14.Javed AA, Aljied R, Allison DJ, et al. Body mass index and all-cause mortality in older adults: A scoping review of observational studies. Obes Rev. 2020;21(8):e13035. doi: 10.1111/obr.13035. 10.1111/obr.13035 PubMed PMID: 32319198. [DOI] [PubMed] [Google Scholar]
- 15.Winter JE, MacInnis RJ, Wattanapenpaiboon N, et al. BMI and all-cause mortality in older adults: a meta-analysis. Am J Clin Nutr. 2014;99(4):875–890. doi: 10.3945/ajcn.113.068122. 10.3945/ajcn.113.068122 PubMed PMID: 24452240. [DOI] [PubMed] [Google Scholar]
- 16.Buckinx F, Croisier JL, Reginster JY, et al. Prediction of the Incidence of Falls and Deaths Among Elderly Nursing Home Residents: The SENIOR Study. J Am Med Dir Assoc. 2018;19(1):18–24. doi: 10.1016/j.jamda.2017.06.014. 10.1016/j.jamda.2017.06.014 PubMed PMID: 28757332. [DOI] [PubMed] [Google Scholar]
- 17.Mason C, Craig CL, Katzmarzyk PT. Influence of central and extremity circumferences on all-cause mortality in men and women. Obesity (Silver Spring) 2008;16(12):2690–2695. doi: 10.1038/oby.2008.438. 10.1038/oby.2008.438 [DOI] [PubMed] [Google Scholar]
- 18.Sharifi F, Ghaderpanahi M, Fakhrzadeh H, et al. Older people’s mortality index: development of a practical model for prediction of mortality in nursing homes (Kahrizak Elderly Study) Geriatr Gerontol Int. 2012;12(1):36–45. doi: 10.1111/j.1447-0594.2011.00724.x. 10.1111/j.1447-0594.2011.00724.x PubMed PMID: 21729224. [DOI] [PubMed] [Google Scholar]
- 19.Tsai A-H, Lai M-C, Chang T-L. Mid-arm and calf circumferences (MAC and CC) are better than body mass index (BMI) in predicting health status and mortality risk in institutionalized elderly Taiwanese. Archives of Gerontology and Geriatrics. 2012;54(3):443–447. doi: 10.1016/j.archger.2011.05.015. 10.1016/j.archger.2011.05.015 PubMed PMID: 21663980. [DOI] [PubMed] [Google Scholar]
- 20.Wijnhoven HAH, van Bokhorst-de van der Schueren MAE, Heymans MW, et al. Low Mid-Upper Arm Circumference, Calf Circumference, and Body Mass Index and Mortality in Older Persons. Journals of Gerontology Series a-Biological Sciences and Medical Sciences. 2010;65(10):1107–1114. doi: 10.1093/gerona/glq100. 10.1093/gerona/glq100 PubMed PMID: 20547497. [DOI] [PMC free article] [PubMed] [Google Scholar]
- 21.de Almeida Roediger M, de Fátima Nunes Marucci M, Quintiliano Scarpelli Dourado DA, et al. Body Composition Changes and 10-Year Mortality Risk in Older Brazilian Adults: Analysis of Prospective Data from the SABE Study. J Nutr Health Aging. 2019;23(1):51–59. doi: 10.1007/s12603-018-1118-1. 10.1007/s12603-018-1118-1 PubMed PMID: 30569068. [DOI] [PubMed] [Google Scholar]
- 22.Moon S, Hong GS. Predictive Factors of Mortality in Older Adult Residents of Long-Term Care Facilities. J Nurs Res. 2020;28(2):e82. doi: 10.1097/jnr.0000000000000356. 10.1097/jnr.0000000000000356 PubMed PMID: 31688278. [DOI] [PubMed] [Google Scholar]
- 23.Saka B, Ozkaya H, Karisik E, et al. Malnutrition and sarcopenia are associated with increased mortality rate in nursing home residents: A prospective study. European Geriatric Medicine. 2016;7(3):232–238. 10.1016/j.eurger.2015.12.010 [Google Scholar]
- 24.Tsai AC, Chang T-L. The effectiveness of BMI, calf circumference and mid-arm circumference in predicting subsequent mortality risk in elderly Taiwanese. British Journal of Nutrition. 2011;105(2):275–281. doi: 10.1017/S0007114510003429. 10.1017/S0007114510003429 PubMed PMID: 21129232. [DOI] [PubMed] [Google Scholar]
- 25.Weng CH, Tien CP, Li CI, et al. Mid-upper arm circumference, calf circumference and mortality in Chinese long-term care facility residents: a prospective cohort study. BMJ Open. 2018;8(5):e020485. doi: 10.1136/bmjopen-2017-020485. 10.1136/bmjopen-2017-020485 PubMed PMID: 29743327, PMCID 5942455. [DOI] [PMC free article] [PubMed] [Google Scholar]
- 26.Allison DB, Zhu SK, Plankey M, et al. Differential associations of body mass index and adiposity with all-cause mortality among men in the first and second National Health and Nutrition Examination Surveys (NHANES I and NHANES II) follow-up studies. Int J Obes Relat Metab Disord. 2002;26(3):410–416. doi: 10.1038/sj.ijo.0801925. 10.1038/sj.ijo.0801925 PubMed PMID: 11896498. [DOI] [PubMed] [Google Scholar]
- 27.Chumlea WC. Is the MNA valid in different populations and across practice settings? J Nutr Health Aging. 2006;10(6):524–527. PubMed PMID: 17183424, discussion 27–33. [PubMed] [Google Scholar]
- 28.Landi F, Camprubi-Robles M, Bear DE, et al. Muscle loss: The new malnutrition challenge in clinical practice. Clin Nutr. 2019;38(5):2113–2120. doi: 10.1016/j.clnu.2018.11.021. 10.1016/j.clnu.2018.11.021 PubMed PMID: 30553578. [DOI] [PubMed] [Google Scholar]
- 29.Wei J, Jiao J, Chen CL, et al. The association between low calf circumference and mortality: a systematic review and meta-analysis. Eur Geriatr Med. 2022. doi: 10.1007/s41999-021-00603-3. [DOI] [PubMed]
- 30.Yin L, Zhang L, Li N, et al. Several anthropometric measurements and cancer mortality: predictor screening, threshold determination, and joint analysis in a multicenter cohort of 12138 adults. Eur J Clin Nutr. 2021. doi: 10.1038/s41430-021-01009-x. [DOI] [PubMed]
- 31.Yang M, Jiang J, Zeng Y, et al. Sarcopenia for predicting mortality among elderly nursing home residents: SARC-F versus SARC-CalF. Medicine (Baltimore) 2019;98(7):e14546. doi: 10.1097/MD.0000000000014546. 10.1097/MD.0000000000014546 [DOI] [PMC free article] [PubMed] [Google Scholar]
- 32.Wu SE, Chen WL. Calf circumference refines sarcopenia in correlating with mortality risk. Age Ageing. 2022;51(2) doi: 10.1093/ageing/afab239. 10.1093/ageing/afab239 [DOI] [PubMed] [Google Scholar]
- 33.Teixeira PP, Kowalski VH, Valduga K, et al. Low Muscle Mass Is a Predictor of Malnutrition and Prolonged Hospital Stay in Patients With Acute Exacerbation of Chronic Obstructive Pulmonary Disease: A Longitudinal Study. JPEN J Parenter Enteral Nutr. 2021;45(6):1221–1230. doi: 10.1002/jpen.1998. 10.1002/jpen.1998 PubMed PMID: 32794593. [DOI] [PubMed] [Google Scholar]
- 34.Sousa IM, Bielemann RM, Gonzalez MC, et al. Low calf circumference is an independent predictor of mortality in cancer patients: A prospective cohort study. Nutrition. 2020;79–80:110816. doi: 10.1016/j.nut.2020.110816. 10.1016/j.nut.2020.110816 PubMed PMID: 32569952. [DOI] [PubMed] [Google Scholar]
- 35.Sobestiansky S, Åberg AC, Cederholm T. Sarcopenia and malnutrition in relation to mortality in hospitalised patients in geriatric care — predictive validity of updated diagnoses. Clin Nutr ESPEN. 2021;45:442–448. doi: 10.1016/j.clnesp.2021.07.002. 10.1016/j.clnesp.2021.07.002 PubMed PMID: 34620352. [DOI] [PubMed] [Google Scholar]
- 36.Sanchez-Rodriguez D, Locquet M, Bruyère O, et al. Prediction of 5-year mortality risk by malnutrition according to the GLIM format using seven pragmatic approaches to define the criterion of loss of muscle mass. Clin Nutr. 2021;40(4):2188–2199. doi: 10.1016/j.clnu.2020.09.047. 10.1016/j.clnu.2020.09.047 PubMed PMID: 33069510. [DOI] [PubMed] [Google Scholar]
- 37.Ren C, Zhang X, Zhu Y, et al. Low calf circumference can predict nutritional risk and mortality in adults with metabolic syndrome aged over 80 years. BMC Endocr Disord. 2022;22(1):47. doi: 10.1186/s12902-022-00964-1. 10.1186/s12902-022-00964-1 PubMed PMID: 35193560, PMCID 8864893. [DOI] [PMC free article] [PubMed] [Google Scholar]
- 38.Nishikawa H, Yoh K, Enomoto H, et al. Combined grip strength and calf circumference as a useful prognostic system in patients with liver diseases: a large cohort study. Ann Transl Med. 2021;9(8):624. doi: 10.21037/atm-20-6901. 10.21037/atm-20-6901 PubMed PMID: 33987322, PMCID 8105999. [DOI] [PMC free article] [PubMed] [Google Scholar]
- 39.Ge YZ, Ruan GT, Zhang KP, et al. Which anthropometric measurement is better for predicting survival of patients with cancer cachexia? Br J Nutr. 2021:1–9. doi: 10.1017/s0007114521002853. [DOI] [PubMed]
- 40.Fernandes DPS, Juvanhol LL, Lozano M, et al. Calf circumference is an independent predictor of mortality in older adults: An approach with generalized additive models. Nutr Clin Pract. 2021. doi: 10.1002/ncp.10780. [DOI] [PubMed]
- 41.Dos Santos Rd CO, Burgel CF, Chites Rd VS, et al. Low-cost and fast-performing indicators of muscle mass loss are good predictors of clinical outcomes in hospitalized patients: A longitudinal observational study. JPEN J Parenter Enteral Nutr. 2021. doi: 10.1002/jpen.2268. [DOI] [PubMed]
- 42.de Sousa IM, Silva FM, de Carvalho ALM, et al. Accuracy of isolated nutrition indicators in diagnosing malnutrition and their prognostic value to predict death in patients with gastric and colorectal cancer: A prospective study. JPEN J Parenter Enteral Nutr. 2022;46(3):508–516. doi: 10.1002/jpen.2199. 10.1002/jpen.2199 PubMed PMID: 34036614. [DOI] [PubMed] [Google Scholar]
- 43.Bernardes S, Silva FM, da Costa CC, et al. Reduced calf circumference is an independent predictor of worse quality of life, severity of disease, frequent exacerbation, and death in patients with chronic obstructive pulmonary disease admitted to a pulmonary rehabilitation program: A historic cohort study. JPEN J Parenter Enteral Nutr. 2022;46(3):546–555. doi: 10.1002/jpen.2214. 10.1002/jpen.2214 PubMed PMID: 34173982. [DOI] [PubMed] [Google Scholar]
- 44.Abreo AP, Bailey SR, Abreo K. Associations between calf, thigh, and arm circumference and cardiovascular and all-cause mortality in NHANES 1999–2004. Nutr Metab Cardiovasc Dis. 2021;31(5):1410–1415. doi: 10.1016/j.numecd.2021.01.011. 10.1016/j.numecd.2021.01.011 PubMed PMID: 33762151. [DOI] [PubMed] [Google Scholar]
- 45.Greenland S, Longnecker MP. Methods for trend estimation from summarized dose-response data, with applications to meta-analysis. Am J Epidemiol. 1992;135(11):1301–1309. doi: 10.1093/oxfordjournals.aje.a116237. 10.1093/oxfordjournals.aje.a116237 PubMed PMID: 1626547. [DOI] [PubMed] [Google Scholar]
- 46.Orsini N, Li R, Wolk A, et al. Meta-analysis for linear and nonlinear dose-response relations: examples, an evaluation of approximations, and software. Am J Epidemiol. 2012;175(1):66–73. doi: 10.1093/aje/kwr265. 10.1093/aje/kwr265 PubMed PMID: 22135359. [DOI] [PMC free article] [PubMed] [Google Scholar]
- 47.Shor E, Roelfs D, Vang ZM. The “Hispanic mortality paradox” revisited: Meta-analysis and meta-regression of life-course differentials in Latin American and Caribbean immigrants’ mortality. Soc Sci Med. 2017;186:20–33. doi: 10.1016/j.socscimed.2017.05.049. 10.1016/j.socscimed.2017.05.049 PubMed PMID: 28577458. [DOI] [PubMed] [Google Scholar]
- 48.VanderWeele TJ. On a Square-Root Transformation of the Odds Ratio for a Common Outcome. Epidemiology. 2017;28(6):e58–e60. doi: 10.1097/EDE.0000000000000733. 10.1097/EDE.0000000000000733 PubMed PMID: 28816709, PMCID 5617805. [DOI] [PMC free article] [PubMed] [Google Scholar]
- 49.Page MJ, McKenzie JE, Bossuyt PM, et al. The PRISMA 2020 statement: an updated guideline for reporting systematic reviews. BMJ. 2021;372:n71. doi: 10.1136/bmj.n71. 10.1136/bmj.n71 PubMed PMID: 33782057, PMCID 8005924. [DOI] [PMC free article] [PubMed] [Google Scholar]
- 50.World Health Organization, Expert Committee on Physical Status: the Use Interpretation of Anthropometry. Physical status: the use and interpretation of anthropometry. Report of a WHO Expert Committee. In. Geneva, Switzerland; 1995. pp. 1–452. [PubMed]
- 51.Stang A. Critical evaluation of the Newcastle-Ottawa scale for the assessment of the quality of nonrandomized studies in meta-analyses. Eur J Epidemiol. 2010;25(9):603–605. doi: 10.1007/s10654-010-9491-z. 10.1007/s10654-010-9491-z PubMed PMID: 20652370. [DOI] [PubMed] [Google Scholar]
- 52.Iorio A, Spencer FA, Falavigna M, et al. Use of GRADE for assessment of evidence about prognosis: rating confidence in estimates of event rates in broad categories of patients. BMJ. 2015;350:h870. doi: 10.1136/bmj.h870. 10.1136/bmj.h870 PubMed PMID: 25775931. [DOI] [PubMed] [Google Scholar]
- 53.Wu CJ, Kao TW, Lin YY, et al. Examining the association between anthropometric parameters and telomere length and mortality risk. Oncotarget. 2017;8(21):34057–34069. doi: 10.18632/oncotarget.15976. 10.18632/oncotarget.15976 PubMed PMID: 28423661, PMCID 5470951. [DOI] [PMC free article] [PubMed] [Google Scholar]
- 54.Schandelmaier S, Briel M, Varadhan R, et al. Development of the Instrument to assess the Credibility of Effect Modification Analyses (ICEMAN) in randomized controlled trials and meta-analyses. CMAJ. 2020;192(32):901–906. doi: 10.1503/cmaj.200077. 10.1503/cmaj.200077 PubMed PMID: 32778601, PMCID 7829020. [DOI] [PMC free article] [PubMed] [Google Scholar]
- 55.Carmelli D, Zhang H, Swan GE. Obesity and 33-year follow-up for coronary heart disease and cancer mortality. Epidemiology. 1997;8(4):378–383. doi: 10.1097/00001648-199707000-00005. 10.1097/00001648-199707000-00005 PubMed PMID: 9209850. [DOI] [PubMed] [Google Scholar]
- 56.Tsai AC, Ku PY. Population-specific Mini Nutritional Assessment effectively predicts the nutritional state and follow-up mortality of institutionalized elderly Taiwanese regardless of cognitive status. Br J Nutr. 2008;100(1):152–158. doi: 10.1017/S0007114507873600. 10.1017/S0007114507873600 PubMed PMID: 18053309. [DOI] [PubMed] [Google Scholar]
- 57.Tsai AC, Yang S-F, Wang J-Y. Validation of population-specific Mini-Nutritional Assessment with its long-term mortality-predicting ability: results of a population-based longitudinal 4-year study in Taiwan. British Journal of Nutrition. 2010;104(1):93–99. doi: 10.1017/S0007114510000188. 10.1017/S0007114510000188 PubMed PMID: 20193094. [DOI] [PubMed] [Google Scholar]
- 58.Ehrlich AC, Smith DA. Abdominal diameter index and 12-year cardiovascular disease incidence in male bridge and tunnel workers. Int J Obes (Lond) 2011;35(3):409–415. doi: 10.1038/ijo.2010.143. 10.1038/ijo.2010.143 [DOI] [PubMed] [Google Scholar]
- 59.Arango-Lopera VE, Arroyo P, Gutiérrez-Robledo LM, et al. Mortality as an adverse outcome of sarcopenia. J Nutr Health Aging. 2013;17(3):259–262. doi: 10.1007/s12603-012-0434-0. 10.1007/s12603-012-0434-0 PubMed PMID: 23459979, PMCID 4764255. [DOI] [PMC free article] [PubMed] [Google Scholar]
- 60.Hsu K-H, Shih C-P, Liao P-J. Waist-to-thigh ratio is a predictor of internal organ cancers in humans: findings from a cohort study. Annals of Epidemiology. 2013;23(6):342–348. doi: 10.1016/j.annepidem.2013.04.004. 10.1016/j.annepidem.2013.04.004 PubMed PMID: 23683710. [DOI] [PubMed] [Google Scholar]
- 61.Tsai AC, Chang TL, Wang JY. Short-form Mini-Nutritional Assessment with either BMI or calf circumference is effective in rating the nutritional status of elderly Taiwanese — results of a national cohort study. Br J Nutr. 2013;110(6):1126–1132. doi: 10.1017/S0007114513000366. 10.1017/S0007114513000366 PubMed PMID: 23432907. [DOI] [PubMed] [Google Scholar]
- 62.Wang JY, Tsai AC. The short-form mini-nutritional assessment is as effective as the full-mini nutritional assessment in predicting follow-up 4-year mortality in elderly Taiwanese. J Nutr Health Aging. 2013;17(7):594–598. doi: 10.1007/s12603-013-0048-1. 10.1007/s12603-013-0048-1 PubMed PMID: 23933869. [DOI] [PubMed] [Google Scholar]
- 63.Abd-El-Gawad WM, Abou-Hashem RM, El Maraghy MO, et al. The validity of Geriatric Nutrition Risk Index: simple tool for prediction of nutritional-related complication of hospitalized elderly patients. Comparison with Mini Nutritional Assessment. Clin Nutr. 2014;33(6):1108–1116. doi: 10.1016/j.clnu.2013.12.005. PubMed PMID: 24418116. [DOI] [PubMed] [Google Scholar]
- 64.Dent E, Chapman IM, Piantadosi C, et al. Performance of nutritional screening tools in predicting poor six-month outcome in hospitalised older patients. Asia Pac J Clin Nutr. 2014;23(3):394–399. doi: 10.6133/apjcn.2014.23.3.18. PubMed PMID: 25164449. [DOI] [PubMed] [Google Scholar]
- 65.Eschbach D, Kirchbichler T, Wiesmann T, et al. Nutritional intervention in cognitively impaired geriatric trauma patients: a feasibility study. Clin Interv Aging. 2016;11:1239–1246. doi: 10.2147/CIA.S109281. 10.2147/CIA.S109281 PubMed PMID: 27672318, PMCID 5026212. [DOI] [PMC free article] [PubMed] [Google Scholar]
- 66.Pan J, Yang X, Zhou X, et al. A prospective study of nutritional status in elderly inpatients with neurological disease. Chinese Journal of Clinical Nutrition. 2016;24(6):338–341. [Google Scholar]
- 67.Brown JC, Harhay MO, Harhay MN. Anthropometrically-predicted visceral adipose tissue and mortality among men and women in the third national health and nutrition examination survey (NHANES III) American Journal of Human Biology. 2017;29(1) doi: 10.1002/ajhb.22898. 10.1002/ajhb.22898 [DOI] [PMC free article] [PubMed] [Google Scholar]
- 68.Turusheva A, Frolova E, Hegendoerfer E, et al. Predictors of short-term mortality, cognitive and physical decline in older adults in northwest Russia: a population-based prospective cohort study. Aging Clinical and Experimental Research. 2017;29(4):665–673. doi: 10.1007/s40520-016-0613-7. 10.1007/s40520-016-0613-7 PubMed PMID: 27492629. [DOI] [PubMed] [Google Scholar]
- 69.Hanatani S, Izumiya Y, Onoue Y, et al. Non-invasive testing for sarcopenia predicts future cardiovascular events in patients with chronic kidney disease. Int J Cardiol. 2018;268:216–221. doi: 10.1016/j.ijcard.2018.03.064. 10.1016/j.ijcard.2018.03.064 PubMed PMID: 29650344. [DOI] [PubMed] [Google Scholar]
- 70.Tanaka T, Takahashi K, Akishita M, et al. “Yubi-wakka” (finger-ring) test: A practical self-screening method for sarcopenia, and a predictor of disability and mortality among Japanese community-dwelling older adults. Geriatr Gerontol Int. 2018;18(2):224–232. doi: 10.1111/ggi.13163. 10.1111/ggi.13163 PubMed PMID: 28898523. [DOI] [PubMed] [Google Scholar]
- 71.Wu CJ, Kao TW, Chang YW, et al. Does the Additional Component of Calf Circumference Refine Metabolic Syndrome in Correlating With Cardiovascular Risk? J Clin Endocrinol Metab. 2018;103(3):1151–1160. doi: 10.1210/jc.2017-02320. 10.1210/jc.2017-02320 PubMed PMID: 29346655. [DOI] [PubMed] [Google Scholar]
- 72.Gattermann Pereira T, da Silva Fink J, Tosatti JAG, et al. Subjective Global Assessment Can Be Performed in Critically Ill Surgical Patients as a Predictor of Poor Clinical Outcomes. Nutr Clin Pract. 2019;34(1):131–136. doi: 10.1002/ncp.10178. 10.1002/ncp.10178 PubMed PMID: 30071139. [DOI] [PubMed] [Google Scholar]
- 73.Li M, Kong Y, Chen H, et al. Accuracy and prognostic ability of the SARC-F questionnaire and Ishii’s score in the screening of sarcopenia in geriatric inpatients. Braz J Med Biol Res. 2019;52(9):e8204. doi: 10.1590/1414-431X20198204. 10.1590/1414-431x20198204 PubMed PMID: 31482974, PMCID 6719342. [DOI] [PMC free article] [PubMed] [Google Scholar]
- 74.Bicakli DH, Uslu R, Güney SC, et al. The Relationship Between Nutritional Status, Performance Status, and Survival Among Pancreatic Cancer Patients. Nutr Cancer. 2020;72(2):202–208. doi: 10.1080/01635581.2019.1634217. 10.1080/01635581.2019.1634217 PubMed PMID: 31271302. [DOI] [PubMed] [Google Scholar]
- 75.Gade J, Quick AA, Beck AM, et al. SARC-F in hospitalized, geriatric medical patients — Feasibility, prevalence of risk of sarcopenia, and characteristics of the risk group, including one-year follow-up. Clin Nutr ESPEN. 2020;37:80–86. doi: 10.1016/j.clnesp.2020.03.016. 10.1016/j.clnesp.2020.03.016 PubMed PMID: 32359760. [DOI] [PubMed] [Google Scholar]
- 76.Tang T, Zhuo Y, Xie L, et al. Sarcopenia index based on serum creatinine and cystatin C is associated with 3-year mortality in hospitalized older patients. Sci Rep. 2020;10(1):1260. doi: 10.1038/s41598-020-58304-z. 10.1038/s41598-020-58304-z PubMed PMID: 31988356, PMCID 6985114. [DOI] [PMC free article] [PubMed] [Google Scholar]
- 77.Yilmaz M, Atilla FD, Sahin F, et al. The effect of malnutrition on mortality in hospitalized patients with hematologic malignancy. Support Care Cancer. 2020;28(3):1441–1448. doi: 10.1007/s00520-019-04952-5. 10.1007/s00520-019-04952-5 PubMed PMID: 31273503. [DOI] [PubMed] [Google Scholar]
- 78.Hanatani S, Izumiya Y, Yamamoto M, et al. A simple method of sarcopenia detection can predict adverse cardiovascular events in patients with abdominal obesity. Int J Obes (Lond) 2021;45(10):2214–2220. doi: 10.1038/s41366-021-00895-2. 10.1038/s41366-021-00895-2 [DOI] [PubMed] [Google Scholar]
- 79.Macedo C, Amaral TF, Rodrigues J, et al. Malnutrition and Sarcopenia Combined Increases the Risk for Mortality in Older Adults on Hemodialysis. Front Nutr. 2021;8:721941. doi: 10.3389/fnut.2021.721941. 10.3389/fnut.2021.721941 PubMed PMID: 34604279, PMCID 8484646. [DOI] [PMC free article] [PubMed] [Google Scholar]
- 80.Mainardi LG, Borges TC, Gomes TLN, et al. Association of SARC-F and dissociation of SARC-F + calf circumference with comorbidities in older hospitalized cancer patients. Exp Gerontol. 2021;148:111315. doi: 10.1016/j.exger.2021.111315. 10.1016/j.exger.2021.111315 PubMed PMID: 33741454. [DOI] [PubMed] [Google Scholar]
- 81.Raffield LM, Howard AG, Graff M, et al. Obesity Duration, Severity, and Distribution Trajectories and Cardiovascular Disease Risk in the Atherosclerosis Risk in Communities Study. J Am Heart Assoc. 2021;10(24):e019946. doi: 10.1161/JAHA.121.019946. 10.1161/JAHA.121.019946 PubMed PMID: 34889111, PMCID 9075238. [DOI] [PMC free article] [PubMed] [Google Scholar]
- 82.Rodrigues FW, Burgel CF, Brito JE, et al. SARC-CalF tool has no significant prognostic value in hospitalized patients: A prospective cohort study. Nutr Clin Pract. 2021;36(5):1072–1079. doi: 10.1002/ncp.10675. 10.1002/ncp.10675 PubMed PMID: 34245469. [DOI] [PubMed] [Google Scholar]
- 83.Vavruk AM, Martins C, Mazza do Nascimento M. Validation of Malnutrition Clinical Characteristics in Critically Ill Patients. Nutr Clin Pract. 2021;36(5):993–1002. doi: 10.1002/ncp.10637. 10.1002/ncp.10637 PubMed PMID: 33686707. [DOI] [PubMed] [Google Scholar]
- 84.Yin L, Lin X, Li N, et al. Evaluation of the Global Leadership Initiative on Malnutrition Criteria Using Different Muscle Mass Indices for Diagnosing Malnutrition and Predicting Survival in Lung Cancer Patients. JPEN J Parenter Enteral Nutr. 2021;45(3):607–617. doi: 10.1002/jpen.1873. 10.1002/jpen.1873 PubMed PMID: 32386328. [DOI] [PubMed] [Google Scholar]
- 85.Lee ZY, Hasan MS, Day AG, et al. Initial development and validation of a novel nutrition risk, sarcopenia, and frailty assessment tool in mechanically ventilated critically ill patients: The NUTRIC-SF score. JPEN J Parenter Enteral Nutr. 2022;46(3):499–507. doi: 10.1002/jpen.2194. 10.1002/jpen.2194 PubMed PMID: 34021917. [DOI] [PubMed] [Google Scholar]
- 86.Lu JL, Xu XY, Chen L, et al. The Predictive Values of Five Sarcopenia Screening Tools on Clinical Outcomes Following Surgery in Patients with Gastric Cancer: A Prospective Cohort Study. J Nutr Health Aging. 2022;26(3):259–265. doi: 10.1007/s12603-022-1751-6. 10.1007/s12603-022-1751-6 PubMed PMID: 35297469. [DOI] [PMC free article] [PubMed] [Google Scholar]
- 87.Osuna-Padilla IA, Rodríguez-Moguel NC, Rodríguez-Llamazares S, et al. Low muscle mass in COVID-19 critically-ill patients: Prognostic significance and surrogate markers for assessment. Clin Nutr. 2022. doi: 10.1016/j.clnu.2022.02.019. [DOI] [PMC free article] [PubMed]
- 88.Ren C, Su H, Tao J, et al. Sarcopenia Index Based on Serum Creatinine and Cystatin C is Associated with Mortality, Nutritional Risk/Malnutrition and Sarcopenia in Older Patients. Clin Interv Aging. 2022;17:211–221. doi: 10.2147/CIA.S351068. 10.2147/CIA.S351068 PubMed PMID: 35256845, PMCID 8898017. [DOI] [PMC free article] [PubMed] [Google Scholar]
- 89.Allen KL, Miskulin D, Yan G, et al. Association of nutritional markers with physical and mental health status in prevalent hemodialysis patients from the HEMO study. J Ren Nutr. 2002;12(3):160–169. doi: 10.1053/jren.2002.33512. 10.1053/jren.2002.33512 PubMed PMID: 12105813. [DOI] [PubMed] [Google Scholar]
- 90.Hsu W-C, Tsai AC, Wang J-Y. Calf circumference is more effective than body mass index in predicting emerging care-need of older adults — Results of a national cohort study. Clinical Nutrition. 2016;35(3):735–740. doi: 10.1016/j.clnu.2015.05.017. 10.1016/j.clnu.2015.05.017 PubMed PMID: 26093536. [DOI] [PubMed] [Google Scholar]
- 91.Perez-Zepeda MU, Gutierrez-Robledo LM. Calf circumference predicts mobility disability: A secondary analysis of the Mexican health and ageing study. European Geriatric Medicine. 2016;7(3):262–266. doi: 10.1016/j.eurger.2016.01.004. 10.1016/j.eurger.2016.01.004 PubMed PMID: 27656259, PMCID 5028111. [DOI] [PMC free article] [PubMed] [Google Scholar]
- 92.Lidoriki I, Schizas D, Mpaili E, et al. Associations between skeletal muscle mass index, nutritional and functional status of patients with oesophago-gastric cancer. Clinical Nutrition Espen. 2019;34:61–67. doi: 10.1016/j.clnesp.2019.08.012. 10.1016/j.clnesp.2019.08.012 PubMed PMID: 31677713. [DOI] [PubMed] [Google Scholar]
- 93.Hsiang C-H, Wu C-J, Kao T-W, et al. Calf circumference and risk of cardiovascular disease. Geriatrics & Gerontology International. 2020;20(12):1133–1137. doi: 10.1111/ggi.14052. 10.1111/ggi.14052 [DOI] [PubMed] [Google Scholar]
- 94.Xu JY, Zhu MW, Zhang H, et al. A Cross-Sectional Study of GLIM-Defined Malnutrition Based on New Validated Calf Circumference Cut-off Values and Different Screening Tools in Hospitalised Patients over 70 Years Old. J Nutr Health Aging. 2020;24(8):832–838. doi: 10.1007/s12603-020-1386-4. 10.1007/s12603-020-1386-4 PubMed PMID: 33009533. [DOI] [PubMed] [Google Scholar]
- 95.Basibuyuk GO, Ayremlou P, Saeidlou SN, et al. A comparison of the different anthropometric indices for assessing malnutrition among older people in Turkey: a large population-based screening. Journal of Health Population and Nutrition. 2021;40(1) doi: 10.1186/s41043-021-00228-z. 10.1186/s41043-021-00228-z [DOI] [PMC free article] [PubMed] [Google Scholar]
- 96.Chang CF, Yeh YL, Chang HY, et al. Prevalence and Risk Factors of Sarcopenia among Older Adults Aged ≥65 Years Admitted to Daycare Centers of Taiwan: Using AWGS 2019 Guidelines. Int J Environ Res Public Health. 2021;18(16) doi: 10.3390/ijerph18168299. 10.3390/ijerph18168299 [DOI] [PMC free article] [PubMed] [Google Scholar]
- 97.Tang M, Ge Y, Zhang Q, et al. Near-term prognostic impact of integrated muscle mass and function in upper gastrointestinal cancer. Clin Nutr. 2021;40(9):5169–5179. doi: 10.1016/j.clnu.2021.07.028. 10.1016/j.clnu.2021.07.028 PubMed PMID: 34461591. [DOI] [PubMed] [Google Scholar]
- 98.Chavarro-Carvajal DA, Ayala AM, Venegas-Sanabria LC, et al. Use of a nutrition-focused quality improvement program for community-living older adults at malnutrition risk is associated with better nutritional outcomes. Clin Nutr ESPEN. 2022;48:291–297. doi: 10.1016/j.clnesp.2022.01.032. 10.1016/j.clnesp.2022.01.032 PubMed PMID: 35331504. [DOI] [PubMed] [Google Scholar]
- 99.Filipovský J, Ducimetière P, Darné B, et al. Abdominal body mass distribution and elevated blood pressure are associated with increased risk of death from cardiovascular diseases and cancer in middle-aged men. The results of a 15- to 20-year follow-up in the Paris prospective study I. Int J Obes Relat Metab Disord. 1993;17(4):197–203. PubMed PMID: 8387968. [PubMed] [Google Scholar]
- 100.Marquis K, Debigaré R, Lacasse Y, et al. Midthigh muscle cross-sectional area is a better predictor of mortality than body mass index in patients with chronic obstructive pulmonary disease. Am J Respir Crit Care Med. 2002;166(6):809–813. doi: 10.1164/rccm.2107031. 10.1164/rccm.2107031 PubMed PMID: 12231489. [DOI] [PubMed] [Google Scholar]
- 101.Heitmann BL, Frederiksen P. Thigh circumference and risk of heart disease and premature death: prospective cohort study. Bmj. 2009;339:b3292. doi: 10.1136/bmj.b3292. 10.1136/bmj.b3292 PubMed PMID: 19729416, PMCID 2737606. [DOI] [PMC free article] [PubMed] [Google Scholar]
- 102.Otgonsuren M, Stepanova M, Gerber L, et al. Anthropometric and Clinical Factors Associated with Mortality in Subjects with Nonalcoholic Fatty Liver Disease. Digestive Diseases and Sciences. 2013;58(4):1132–1140. doi: 10.1007/s10620-012-2446-3. 10.1007/s10620-012-2446-3 PubMed PMID: 23143735. [DOI] [PubMed] [Google Scholar]
- 103.Wu L-W, Lin Y-Y, Kao T-W, et al. Mid-Arm Circumference and All-Cause, Cardiovascular, and Cancer Mortality among Obese and Non-Obese US Adults: the National Health and Nutrition Examination Survey III. Scientific Reports. 2017;7 doi: 10.1038/s41598-017-02663-7. 10.1038/s41598-017-02663-7 [DOI] [PMC free article] [PubMed] [Google Scholar]
- 104.Chen CL, Liu L, Huang JY, et al. Thigh Circumference and Risk of All-Cause, Cardiovascular and Cerebrovascular Mortality: A Cohort Study. Risk Manag Healthc Policy. 2020;13:1977–1987. doi: 10.2147/RMHP.S264435. 10.2147/RMHP.S264435 PubMed PMID: 33116978, PMCID 7549877. [DOI] [PMC free article] [PubMed] [Google Scholar]
- 105.Hirudayakanth K, Gadama L, Dadabhai S, et al. Mid-thigh circumference as an indicator of nutritional status to predict adverse pregnancy outcomes among HIV-infected and HIV-uninfected women in Malawi. Bmc Pregnancy and Childbirth. 2021;21(1) doi: 10.1186/s12884-021-04118-4. 10.1186/s12884-021-04118-4 [DOI] [PMC free article] [PubMed] [Google Scholar]
- 106.Kawamoto R, Kikuchi A, Akase T, et al. Thigh circumference and handgrip strength are significantly associated with all-cause mortality: findings from a study on Japanese community-dwelling persons. Eur Geriatr Med. 2021;12(6):1191–1200. doi: 10.1007/s41999-021-00515-2. 10.1007/s41999-021-00515-2 PubMed PMID: 34027601. [DOI] [PubMed] [Google Scholar]
- 107.Rocco MV, Dwyer JT, Larive B, et al. The effect of dialysis dose and membrane flux on nutritional parameters in hemodialysis patients: results of the HEMO Study. Kidney Int. 2004;65(6):2321–2334. doi: 10.1111/j.1523-1755.2004.00647.x. 10.1111/j.1523-1755.2004.00647.x PubMed PMID: 15149346. [DOI] [PubMed] [Google Scholar]
- 108.Albuquerque S, Oliveira P, Alves da Silva S, et al. Hyperglycemia, clinical evolution and nutritional condition of critically ill patients. Nutricion Clinica Y Dietetica Hospitalaria. 2018;38(2):70–76. [Google Scholar]
- 109.Cardoso AS, Xavier MO, Dos Santos Costa C, et al. Body mass index and mortality among community-dwelling elderly of Southern Brazil. Prev Med. 2020;139:106173. doi: 10.1016/j.ypmed.2020.106173. 10.1016/j.ypmed.2020.106173 PubMed PMID: 32592797. [DOI] [PubMed] [Google Scholar]
- 110.Chew STH, Tan NC, Cheong M, et al. Impact of specialized oral nutritional supplement on clinical, nutritional, and functional outcomes: A randomized, placebo-controlled trial in community-dwelling older adults at risk of malnutrition. Clin Nutr. 2021;40(4):1879–1892. doi: 10.1016/j.clnu.2020.10.015. 10.1016/j.clnu.2020.10.015 PubMed PMID: 33268143. [DOI] [PubMed] [Google Scholar]
- 111.Guo J, Shang Y, Fratiglioni L, et al. Individual changes in anthropometric measures after age 60 years: a 15-year longitudinal population-based study. Age and Ageing. 2021;50(5):1666–1674. doi: 10.1093/ageing/afab045. 10.1093/ageing/afab045 PubMed PMID: 33765116, PMCID 8437063. [DOI] [PMC free article] [PubMed] [Google Scholar]
- 112.Zhang XM, Wu X, Ma Y, et al. Comparing the Performance of Calf Circumference, Albumin, and BMI for Predicting Mortality in Immobile Patients. Risk Manag Healthc Policy. 2021;14:2289–2300. doi: 10.2147/RMHP.S311692. 10.2147/RMHP.S311692 PubMed PMID: 34104019, PMCID 8180277. [DOI] [PMC free article] [PubMed] [Google Scholar]
- 113.Yin L, Lin X, Zhao Z, et al. Is hand grip strength a necessary supportive index in the phenotypic criteria of the GLIM-based diagnosis of malnutrition in patients with cancer? Supportive Care in Cancer. 2021;29(7):4001–4013. doi: 10.1007/s00520-020-05975-z. 10.1007/s00520-020-05975-z PubMed PMID: 33398429. [DOI] [PubMed] [Google Scholar]
- 114.Wijnhoven HA, van Bokhorst-de van der Schueren MA, Heymans MW, et al. Low mid-upper arm circumference, calf circumference, and body mass index and mortality in older persons. J Gerontol A Biol Sci Med Sci. 2010;65(10):1107–1114. doi: 10.1093/gerona/glq100. 10.1093/gerona/glq100 PubMed PMID: 20547497. [DOI] [PMC free article] [PubMed] [Google Scholar]
- 115.Tsai AC, Chang TL. The effectiveness of BMI, calf circumference and mid-arm circumference in predicting subsequent mortality risk in elderly Taiwanese. Br J Nutr. 2011;105(2):275–281. doi: 10.1017/S0007114510003429. 10.1017/S0007114510003429 PubMed PMID: 21129232. [DOI] [PubMed] [Google Scholar]
- 116.Lin SJ, Hwang SJ, Liu CY, et al. The relationship between nutritional status and physical function, admission frequency, length of hospital stay, and mortality in old people living in long-term care facilities. J Nurs Res. 2012;20(2):110–121. doi: 10.1097/jnr.0b013e318254eac9. 10.1097/jnr.0b013e318254eac9 PubMed PMID: 22592106. [DOI] [PubMed] [Google Scholar]
- 117.Bourdel-Marchasson I, Diallo A, Bellera C, et al. One-Year Mortality in Older Patients with Cancer: Development and External Validation of an MNA-Based Prognostic Score. PLoS One. 2016;11(2):e0148523. doi: 10.1371/journal.pone.0148523. 10.1371/journal.pone.0148523 PubMed PMID: 26859298, PMCID 4747505. [DOI] [PMC free article] [PubMed] [Google Scholar]
- 118.Ho SC, Wang JY, Kuo HP, et al. Mid-arm and calf circumferences are stronger mortality predictors than body mass index for patients with chronic obstructive pulmonary disease. Int J Chron Obstruct Pulmon Dis. 2016;11:2075–2080. doi: 10.2147/COPD.S107326. 10.2147/COPD.S107326 PubMed PMID: 27621613, PMCID 5012597. [DOI] [PMC free article] [PubMed] [Google Scholar]
- 119.Kamiya K, Masuda T, Matsue Y, et al. Prognostic Usefulness of Arm and Calf Circumference in Patients ≥65 Years of Age With Cardiovascular Disease. Am J Cardiol. 2017;119(2):186–191. doi: 10.1016/j.amjcard.2016.09.040. 10.1016/j.amjcard.2016.09.040 PubMed PMID: 27823596. [DOI] [PubMed] [Google Scholar]
- 120.Yajima Y, Kikutani T, Tamura F, et al. Relationship between tongue strength and 1-year life expectancy in elderly people needing nursing care. Odontology. 2017;105(4):477–483. doi: 10.1007/s10266-016-0289-7. 10.1007/s10266-016-0289-7 PubMed PMID: 28058515. [DOI] [PubMed] [Google Scholar]
- 121.Easton JF, Stephens CR, Román-Sicilia H, et al. Anthropometric measurements and mortality in frail older adults. Exp Gerontol. 2018;110:61–66. doi: 10.1016/j.exger.2018.05.011. 10.1016/j.exger.2018.05.011 PubMed PMID: 29775746, PMCID 6109418. [DOI] [PMC free article] [PubMed] [Google Scholar]
- 122.da Silva JR, Jr., Wiegert EVM, Oliveira L, et al. Different methods for diagnosis of sarcopenia and its association with nutritional status and survival in patients with advanced cancer in palliative care. Nutrition. 2019;60:48–52. doi: 10.1016/j.nut.2018.09.003. 10.1016/j.nut.2018.09.003 PubMed PMID: 30529186. [DOI] [PubMed] [Google Scholar]
- 123.Monereo-Muñoz M, Martín-Ponce E, Hernández-Luis R, et al. Prognostic value of muscle mass assessed by DEXA in elderly hospitalized patients. Clin Nutr ESPEN. 2019;32:118–124. doi: 10.1016/j.clnesp.2019.04.001. 10.1016/j.clnesp.2019.04.001 PubMed PMID: 31221276. [DOI] [PubMed] [Google Scholar]
- 124.Rodrigues J, Santin F, Brito F, et al. Nutritional status of older patients on hemodialysis: Which nutritional markers can best predict clinical outcomes? Nutrition. 2019;65:113–119. doi: 10.1016/j.nut.2019.03.002. 10.1016/j.nut.2019.03.002 PubMed PMID: 31082788. [DOI] [PubMed] [Google Scholar]
- 125.Aliberti MJR, Szlejf C, Covinsky KE, et al. Prognostic value of a rapid sarcopenia measure in acutely ill older adults. Clin Nutr. 2020;39(7):2114–2120. doi: 10.1016/j.clnu.2019.08.026. 10.1016/j.clnu.2019.08.026 PubMed PMID: 31526610. [DOI] [PMC free article] [PubMed] [Google Scholar]
- 126.de Sousa OV, Mendes J, Amaral TF. Nutritional and Functional Indicators and Their Association With Mortality Among Older Adults With Alzheimer’s Disease. Am J Alzheimers Dis Other Demen. 2020;35 doi: 10.1177/1533317520907168. 10.1177/1533317520907168 1533317520907168, PubMed PMID: 32088972. [DOI] [PMC free article] [PubMed] [Google Scholar]
- 127.Tarnowski M, Stein E, Marcadenti A, et al. Calf Circumference Is a Good Predictor of Longer Hospital Stay and Nutritional Risk in Emergency Patients: A Prospective Cohort Study. J Am Coll Nutr. 2020;39(7):645–649. doi: 10.1080/07315724.2020.1723452. 10.1080/07315724.2020.1723452 PubMed PMID: 32083521. [DOI] [PubMed] [Google Scholar]
- 128.Valmorbida E, Trevisan C, Imoscopi A, et al. Malnutrition is associated with increased risk of hospital admission and death in the first 18 months of institutionalization. Clin Nutr. 2020;39(12):3687–3694. doi: 10.1016/j.clnu.2020.03.029. 10.1016/j.clnu.2020.03.029 PubMed PMID: 32291111. [DOI] [PubMed] [Google Scholar]
- 129.Cao L, Morley JE. Sarcopenia Is Recognized as an Independent Condition by an International Classification of Disease, Tenth Revision, Clinical Modification (ICD-10-CM) Code. J Am Med Dir Assoc. 2016;17(8):675–677. doi: 10.1016/j.jamda.2016.06.001. 10.1016/j.jamda.2016.06.001 PubMed PMID: 27470918. [DOI] [PubMed] [Google Scholar]
- 130.Kim S, Kim M, Lee Y, et al. Calf Circumference as a Simple Screening Marker for Diagnosing Sarcopenia in Older Korean Adults: the Korean Frailty and Aging Cohort Study (KFACS) J Korean Med Sci. 2018;33(20):e151. doi: 10.3346/jkms.2018.33.e151. 10.3346/jkms.2018.33.e151 PubMed PMID: 29760608, PMCID 5944215. [DOI] [PMC free article] [PubMed] [Google Scholar]
- 131.Wang L, Yin L, Zhao Y, et al. Muscle Density, but Not Size, Correlates Well With Muscle Strength and Physical Performance. J Am Med Dir Assoc. 2020. doi: 10.1016/j.jamda.2020.06.052. [DOI] [PubMed]
- 132.Wang L, Yin L, Zhao Y, et al. Muscle density discriminates hip fracture better than computed tomography X-ray absorptiometry hip areal bone mineral density. J Cachexia Sarcopenia Muscle. 2020. doi: 10.1002/jcsm.12616. [DOI] [PMC free article] [PubMed]
- 133.Yin L, Xu Z, Wang L, et al. Associations of Muscle Size and Density With Proximal Femur Bone in a Community Dwelling Older Population. Front Endocrinol (Lausanne) 2020;11:503. doi: 10.3389/fendo.2020.00503. 10.3389/fendo.2020.00503 [DOI] [PMC free article] [PubMed] [Google Scholar]
- 134.Cooper C, Fielding R, Visser M, et al. Tools in the assessment of sarcopenia. Calcif Tissue Int. 2013;93(3):201–210. doi: 10.1007/s00223-013-9757-z. 10.1007/s00223-013-9757-z PubMed PMID: 23842964, PMCID 3744387. [DOI] [PMC free article] [PubMed] [Google Scholar]
- 135.Mijnarends DM, Meijers JM, Halfens RJ, et al. Validity and reliability of tools to measure muscle mass, strength, and physical performance in community-dwelling older people: a systematic review. J Am Med Dir Assoc. 2013;14(3):170–178. doi: 10.1016/j.jamda.2012.10.009. 10.1016/j.jamda.2012.10.009 PubMed PMID: 23276432. [DOI] [PubMed] [Google Scholar]
- 136.Shih R, Wang Z, Heo M, et al. Lower limb skeletal muscle mass: development of dual-energy X-ray absorptiometry prediction model. J Appl Physiol (1985) 2000;89(4):1380–1386. doi: 10.1152/jappl.2000.89.4.1380. 10.1152/jappl.2000.89.4.1380 [DOI] [PubMed] [Google Scholar]
- 137.Wang L, Yin L, Cheng X, et al. The association of calcium intake with osteoporotic vertebral fractures in a large Chinese cohort. Aging (Albany NY) 2020;12(6):5500–5515. doi: 10.18632/aging.102974. 10.18632/aging.102974 [DOI] [PMC free article] [PubMed] [Google Scholar]
- 138.Kawakami R, Miyachi M, Sawada SS, et al. Cut-offs for calf circumference as a screening tool for low muscle mass: WASEDA’S Health Study. Geriatr Gerontol Int. 2020;20(10):943–950. doi: 10.1111/ggi.14025. 10.1111/ggi.14025 PubMed PMID: 32886830, PMCID 7590124. [DOI] [PMC free article] [PubMed] [Google Scholar]
- 139.Hsiang CH, Wu CJ, Kao TW, et al. Calf circumference and risk of cardiovascular disease. Geriatr Gerontol Int. 2020. doi: 10.1111/ggi.14052. [DOI] [PubMed]
- 140.Gonzalez MC, Mehrnezhad A, Razaviarab N, et al. Calf circumference: cutoff values from the NHANES 1999–2006. Am J Clin Nutr. 2021;113(6):1679–1687. doi: 10.1093/ajcn/nqab029. 10.1093/ajcn/nqab029 PubMed PMID: 33742191, PMCID 8433492. [DOI] [PMC free article] [PubMed] [Google Scholar]
- 141.Lim WS, Lim JP, Chew J, et al. Calf Circumference as a Case-Finding Tool for Sarcopenia: Influence of Obesity on Diagnostic Performance. J Am Med Dir Assoc. 2020;21(9):1359–1361. doi: 10.1016/j.jamda.2020.03.033. 10.1016/j.jamda.2020.03.033 PubMed PMID: 32402782. [DOI] [PubMed] [Google Scholar]
- 142.Asai C, Akao K, Adachi T, et al. Maximal calf circumference reflects calf muscle mass measured using magnetic resonance imaging. Arch Gerontol Geriatr. 2019;83:175–178. doi: 10.1016/j.archger.2019.04.012. 10.1016/j.archger.2019.04.012 PubMed PMID: 31071533. [DOI] [PubMed] [Google Scholar]
Associated Data
This section collects any data citations, data availability statements, or supplementary materials included in this article.
Supplementary Materials
Supplementary material, approximately 341 KB.