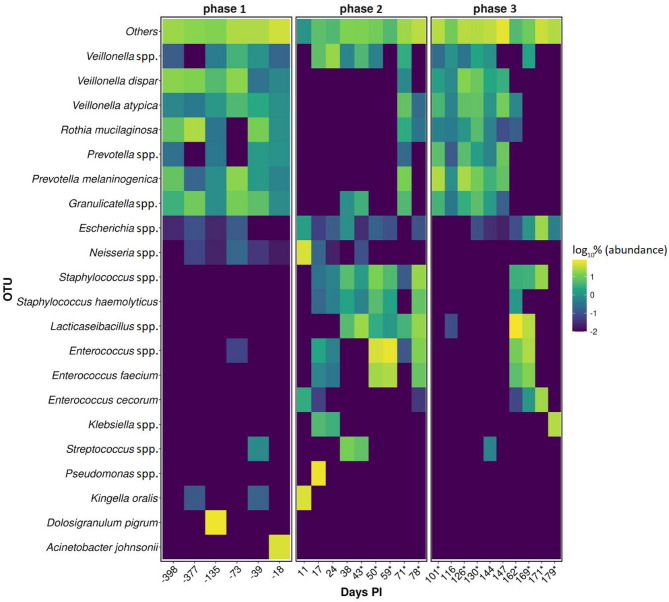
Fig. 3.
Heatmap showing the 21 most abundant bacterial operational taxonomic units (OTUs) (y-axis) per day PI (x-axis). The remaining species detected are grouped in one category (Others). Each of the three phases represents samples according to SARS-CoV-2 infection status. The color of each box corresponds to the relative abundance of respective bacterial species as log10%. If a box is not visible, the species was not detected in the respective sample; * marks days on which a specific antiviral treatment was administered

