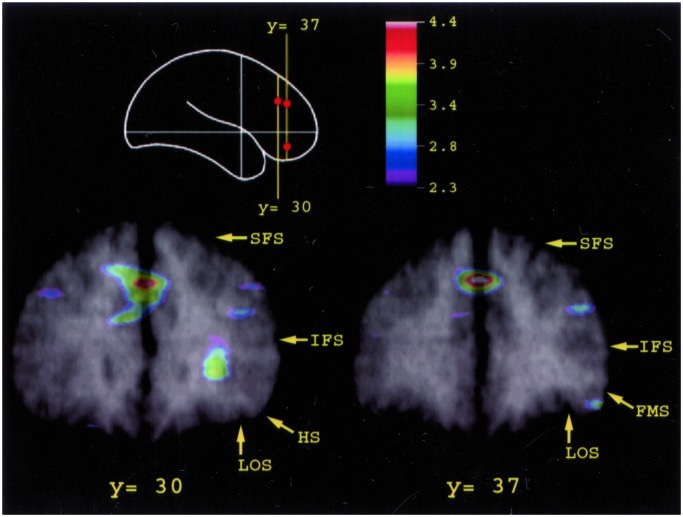
Figure 4.
Merged PET and MRI sections illustrating the average CBF increase for all subjects in the mid-dorsolateral prefrontal area 9/46 on the middle frontal gyrus above the inferior frontal sulcus (IFS) and in mid-ventrolateral prefrontal area 47/12 observed in the monitoring minus the control comparison. The schematic outline of the brain indicates the level of the coronal sections. Abbreviations as in Fig. 3.

