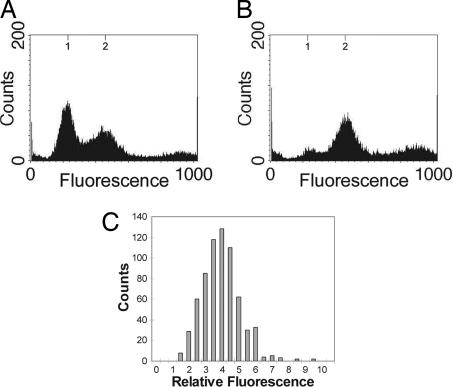
Fig. 2.
Quantitation of DNA content in fruiting body-derived myxospores. (A and B) Shown are the flow cytometric profiles of 5-day-old fruiting bodies (A) purified into myxospores (B). Axes are as in Fig. 1. (C) A histogram of the fluorescence measurements for myxospores (n = 679). The y axis represents cell number, and the x axis represents the fluorescence intensity of DAPI in each myxospore relative to B. subtilis spores in the same field.

