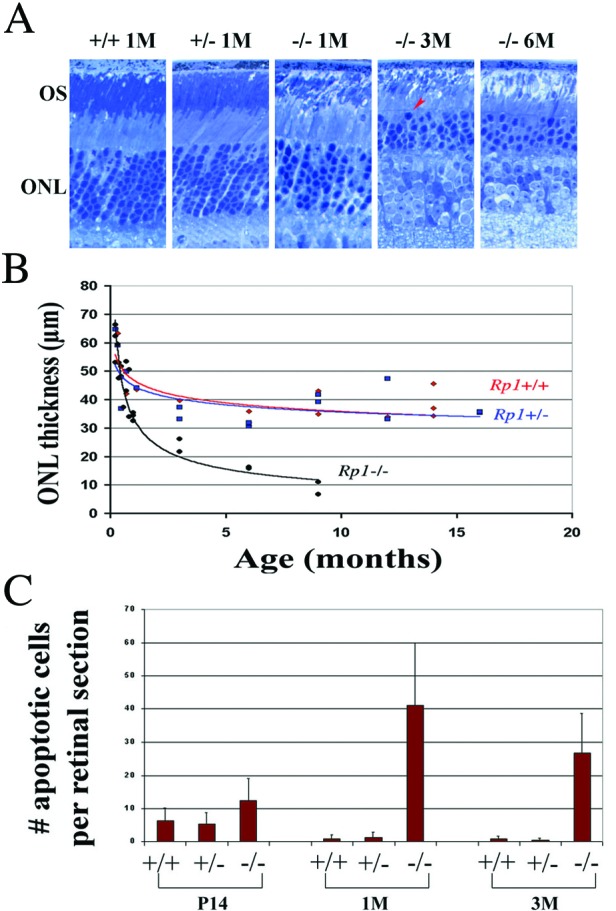
Figure 2.

(A) Light micrographs of epoxy-embedded sections of the central retinas of Rp1 mutant mice at ages 1 (1M), 3 (3M), and 6 (6M) months. THe arrowhead labels an apparent pyknotic nucleus. (B) ONL thickness according to age in Rp1 mutant mice. Each point represents average measurements from one animal. (C) The number of apoptotic cells in ONL of retinal sections from the three genotypes at various ages. Each section was made either frontally or transversely near the optic nerve head. TUNEL-positive cells were counted from the ora serrata through the optic nerve; more than three evenly spaced sections were counted in each animal. The mean values for each animal were calculated. Group mean values and SDs (bars) are shown.
