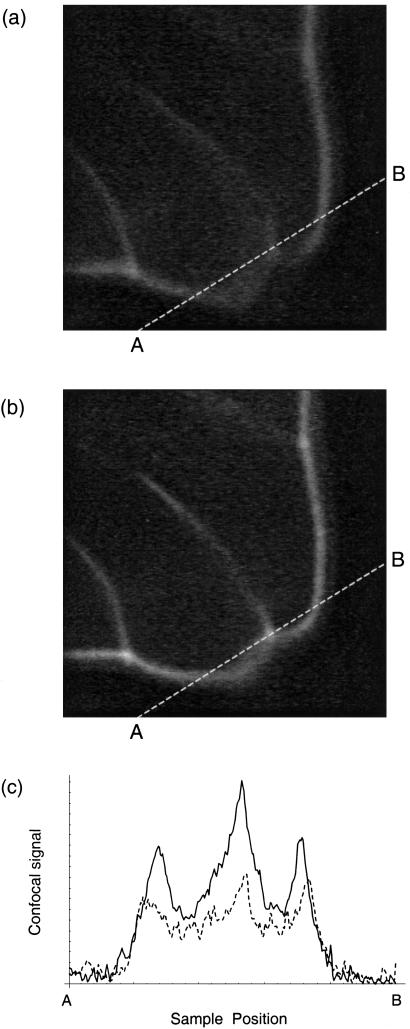
Figure 4.
Confocal x-y scans of the fluorescently labeled mouse intestine before correction (a) and after correction (b). The image dimensions in the x and y directions are 20 μm. Both images were sampled with a bilinear interpolation method at 250 sample points along the line marked AB. The results are illustrated in c, where the dashed line corresponds to the uncorrected image (a), and the solid line corresponds to the corrected image (b).

