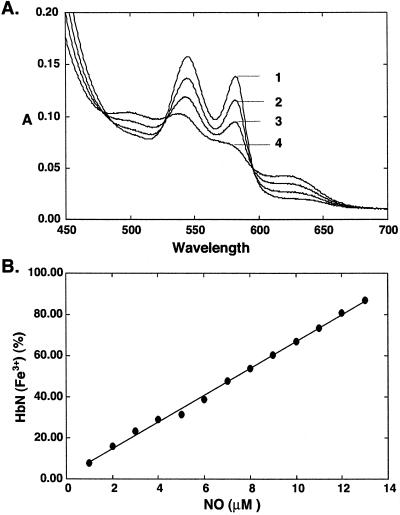
Figure 4.
Titration of NO against trHbN⋅O2. Repeated additions of a saturated aqueous NO solution were made to trHbN⋅O2 (15 μM heme content). (A) Spectra were recorded after equilibrium was reached. The addition of NO led to the rapid appearance of a partial oxidized spectrum. A spectrum of the fully oxidized proteins was obtained after 14 additions of NO (14 μM NO). Subsequent additions of NO resulted in the formation of the ferric–NO complex of the proteins (data not shown). 1, trHbN⋅O2; 2, 3, and 4, 4, 8, and 12 μM NO, respectively. (B) Fraction (%) of oxidized protein was plotted against NO concentration.

