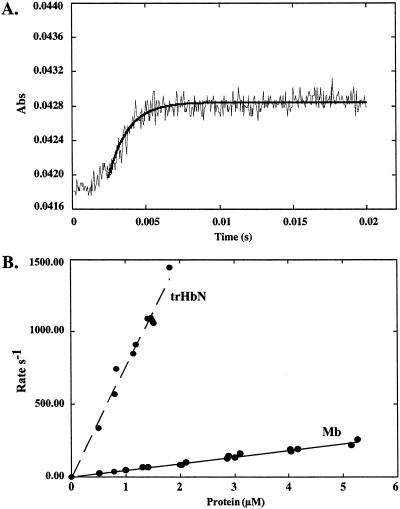
Figure 5.
Time course and rate constant for the oxidation of trHbN⋅O2. (A) Time course (average of six traces) measured at 404 nm for the reaction of 0.8 μM trHbN⋅O2 with ≈0.08 μM NO at pH 7.5 and 23°C. The solid line corresponds to the best fit to the data with one exponential. (B) Plots of the rates (s−1) versus trHbN⋅O2 and horse heart Mb⋅O2 concentrations at pH 7.5 and 23°C.

