



Abstract
Strategies to reduce greenhouse gas emissions may provide health benefits through improved air quality, yet these benefits might not be equitably distributed. Understanding these cobenefits and who receives them can aid policymakers in prioritizing mitigation strategies. We investigated four future energy scenarios (port electrification, electric vehicles, natural gas, energy efficiency) and a business-as-usual scenario to determine how changes to ambient fine particle (PM2.5) levels impact health within the contiguous United States (U.S.) by region, race/ethnicity, urbanicity, and income. We also investigated how methodological assumptions affect findings. Our projections of avoided mortalities from energy transition policies range from 67,011 (95% CI: 45,692, 82,397) to 81,003 (55,286, 99,532) in 2050. The monetized health benefits from avoided mortalities and hospitalizations range from $785.8 billion to $949.9 billion/year. These benefits vary by region and subpopulation, with Black, suburban, and less wealthy Americans experiencing higher percent avoided mortality across scenarios. Results were sensitive to assumptions for future concentration–response functions relating pollution levels to health, baseline incidence rates, and population projections. Our findings indicate energy policies transitioning from fossil fuel production in the U.S. provide substantial health and economic benefits that vary across populations and help reduce environmental health inequities in exposure and associated morality.
Keywords: PM2.5, co-benefits, energy policy, environmental justice, exposure disparities
Graphical Abstract

INTRODUCTION
Air pollution is a leading cause of death with 6.67 to 8 million premature mortalities per year worldwide.1,2 Substantial evidence shows that exposure to fine particulate matter (PM2.5) contributes to premature mortality and morbidity.3–7 PM2.5 is the leading contributor of global disease burden, totaling 8% of all disability-adjusted life years (DALYs)8 and nearly 4.6 million deaths each year.9
United States (U.S.) cohort studies have shown differential mortality risk across subpopulations by age, race/ethnicity, education, income, and urbanicity/rurality.10–12 Social deprivation and other measures of socioeconomic status have been identified as independent risk factors for PM2.5-mortality in the U.S.13–15 Previous work indicated that concentration–response functions (CRF) vary by location, season, and time period.16,17 This is attributed to differences in overall concentrations, population characteristics and particulate composition.18–22
Economy-wide fossil fuel combustion is a major PM2.5 contributor, thus future projections of overall PM2.5 levels and subsequent health outcomes depend greatly on assumed emissions levels and their patterns across regions and subpopulations. These emissions may drastically alter due to climate mitigation, air quality, and economic strategies. Strong evidence of such includes coal electricity generation displacement by gas-fired and renewable power over the past decade. Simultaneously, climate change could impact air pollution levels through changes in dispersion, dry and wet deposition, and photochemical reactions (e.g., secondary pollutant generation), which are related to meteorological patterns. Numerous studies estimate future health impacts of PM2.5 from both energy policy changes and climactic changes.23–31 A meta-analysis of 36 studies across 17 countries identified positive coimpacts (often called cobenefits) to human health from greenhouse gas emission reductions across energy use domains, with possible multiplicative impacts across sectors.32 Several studies also researched regional differences across the U.S. and globally for health coimpacts from proposed and enacted energy policies.24,29,33–40
However, few health studies on ancillary air quality and health impacts of energy policies examined differential impacts across demographic and social factors of affected populations. Other studies showed disparities related to PM2.5, both for exposure and subsequent health response, across the U.S. by race/ethnicity and socioeconomic status, but most such studies are for the present day with few investigating how environmental health disparities are affected by coimpacts from energy policies into the future.41–48 A 2016 review of air quality policies and future health coimpacts in Europe highlighted only three studies that investigated a component of equity.49 Some more recent studies investigated future energy, transportation, or carbon-pricing policy projections and health equity include analysis stratified by income in New York City,50,51 by race/ethnicity in Boston,52 by disadvantaged neighborhoods in California,53,54 by race/ethnicity across the U.S.,55,56 and by region in China.57 While these studies provide critical evidence that coimpacts are not shared equally, existing research is limited in policy exploration and subpopulation inequity.42,49,51,52 Understanding the health cobenefits of energy policies is critical to addressing climate change and understanding whether such policies exacerbate or lessen disparities. Complicating such research is the wide range of methodologies and assumptions applied.31
By linking energy-economy, air quality and climate change modeling; epidemiology; and economic analysis, we estimate how projected changes to PM2.5 from different energy transition scenarios would affect human health for the contiguous U.S., including by regions and subpopulations under various selected health impact assessment (HIA) model assumptions. Our goal is to estimate how public health benefits differ across energy transition strategies and evaluate how the distribution of benefits differs. In other words, a scenario under which population health is improved overall may not be the most beneficial scenario for all subpopulations. As secondary analysis, we examine how methodological assumptions impact results.
METHODS
An HIA framework was developed to investigate overall health impacts and disparities from air quality changes in 2050 across energy policy projections based on a business-as-usual (BAU) emissions scenario of U.S. policies in place at the beginning of 2017 and four scenarios of sector-specific changes in policy. We combined engineering-economic energy simulations; air quality modeling; epidemiology; and economic analysis. Figure S1 presents a flowchart of the methodology.
Energy Emission Scenarios.
Five energy policy scenarios represent the culmination of research and extensive communication with state-level air quality policymakers.58 It was determined that traditional scenarios modeled in cobenefits research (e.g., net zero emissions) are useful but did not match what policymakers felt most impactful. This is the impetus for selection of our energy policies: 2017 National and Subnational Policy Scenario (BAU), inclusion of all energy and climate policies passed through 2017;59 Marine Shipping and Port Electrification Scenario (Port), including electrification in ports, emissions control areas, and of all associated fuels;59 High Electric Vehicle Uptake Scenario (HighEV), assuming a 60% adoption rate by 2040;60 Low Long-Term Natural Gas Pricing Scenario (HighNG), assuming high utilization of unproven U.S. gas reserves;61 and Innovations in Building Energy Efficiency Scenario (HighEE), assuming 16% overall energy reductions through efficiency.62 We use versions for each sector that align with the most ambitious scenarios we found among industry analysts from the government or private sector. Detailed information on these policies and their modeling approaches58–64 can be found in Supporting Information.
Air Quality Modeling for PM2.5.
PM2.5 levels, along with PM2.5 precursors, were modeled previously for current and future concentrations using the WRF-Chem air quality modeling platform, with the surface layer results used for analysis.65 PM2.5 predictions were generated at 36 × 36km resolution for the contiguous U.S. for the baseline year 2010 (5 year 2008–2012 average) and five policy scenarios in 2050 (5 year 2048–2052 average). This model computes hourly PM2.5, and these data were aggregated across each five-year period. Concentration data were area-weighted to county averages.66 The 5 year average PM2.5 predictions were evaluated using observations from the US EPA surface monitoring network. Normalized mean biases and errors are within ± 15 and ± 22%, which are considered high performing. These results are being analyzed for a separate journal publication.
Population Characteristics.
Demographic data were retrieved from the 5 year 2016–2020 U.S. Census American Community Survey (ACS) county-level data and include the 18+ population by race (White, Black, Asian and Pacific Islander, Native American, Two or More, Other), ethnicity (Hispanic, Non-Hispanic), age (18–64, 65–74, 75+ years), and annual income (<$35,000, $35,000–$49,999, $50,000–$74,999, ≥ $75,000).67 Urban status was defined by the 2013 National Center for Health Statistics (NCHS) Urban-Rural Classification Scheme for Counties by population size (Large Central Metro, Large Fringe Metro, Medium Metro, Small Metro, Micropolitan, and Non-Core).68 Population characteristics were chosen based on availability to incidence rates and CRF in the literature. Age groupings and income mirror CRFs from the literature,7,10,12 while race/ethnicity followed availability of groupings in the Census ACS data67 and urban status with the more nuanced NCHS data than a simplistic urban/rural demarcation.68
Projected Population Characteristics.
Population projections from the 2017 U.S. Census Bureau National Projections were used to estimate 2050 18+ populations, consistent with the energy policy modeling. An increase ratio of 1.169201 from the U.S. Census 5 year ACS data69 was used to estimate the population overall and by subpopulation (U.S. Census region, income, urbanicity). Race/ethnicity subpopulation projections were determined through the 2017 U.S. Census Bureau National Projections using population rate change multipliers of: Hispanic (1.6015599), non-Hispanic (1.0695383), White (1.0758291), Black (1.2680511), Asian and Pacific Islander (1.6290942), Native American or Alaskan Native (1.262051), and Two or More Races, nondifferentiated (2.1368861).69 The Other race category in the ACS data was not represented under the U.S. Census projections and was assumed to follow the overall population change rate.
Incidence Rates.
Baseline incidence rates for mortality were determined from county-level, race/ethnicity- and age-stratified data from the CDC WONDER mortality data set (2015–2019).70 Cardiovascular and respiratory hospital admissions rates were determined using Agency for Healthcare Research and Quality (AHRQ) Healthcare Cost and Utilization Project (HCUP) National Inpatient Sample (NIS) data, which include ICD-10-CM diagnoses across the contiguous U.S. and District of Columbia, covering 97% of the U.S. population, except for Delaware and New Hampshire in 2016 and New Hampshire in 2017.71 Incidence rates for morbidity were grouped from 2016 to 2019. County-specific incidence rates were calculated by age (18–64, 65–74, ≥ 75 years) for overall population and race/ethnic-specific subpopulations matching the 5year ACS population data for each age grouping and available CRFs. County-level data were unavailable for 54 counties for which state-wide incidence rates were substituted.
Concentration–Response Functions.
CRFs link air pollution exposure change and risk of health outcome. CRFs were identified from an epidemiological literature review for associations between long-term PM2.5 exposure (≥1 year average) and mortality or hospitalization (including all-cause, respiratory, and cardiovascular hospitalizations) in large, representative U.S. cohort studies. CRFs were selected from published papers based on data collected within the last 15 years for mortality7,10,12 and cardiovascular and respiratory hospitalizations.72 An alternate mortality CRF was also considered.7 For mortality, we considered separate CRFs by age, income (<$35,000, $35,000-$49,999, $50,000-$74,999, ≥ $75,000/year), urbanicity (Urban, Rural), U.S. Census Region (Northeast, Midwest, South, West)12 and race/ethnicity for White, Black, Two or more races, Other Race, Non-Hispanic, and Hispanic 18+ populations12 and Asian/Pacific Islander and Native American 65+ populations.10
Health Impact Functions: Deaths and Hospitalizations.
Estimation of changes in the number of avoided premature deaths for a given scenario was determined through a health impact function corresponding to differences in pollution levels between the reference (2010) and each of the five (BAU plus four alternative) policy scenarios across subpopulations, as well as comparison between the 2050 BAU projections against the four alternative policy projections
where y0ati is the baseline incidence mortality rate for population Pati for subgroup a, energy policy t, and county i; ba is the CRF for subpopulation a; and Δxti is change in PM2.5 concentration for policy t and county i.22,73–79
Change in hospitalizations were calculated as follows
where HA0ati is the baseline cause-specific hospital admission rate for subgroup a, energy policy t, and county i. Other terms are described above.
These equations were applied to each county, using the corresponding incidence rate, population projection, CRF, and PM2.5 concentration changes for 2050. We use the 95%CI values from CRF inputs as our projected 95%CI in the results.
Health Impact Function Model Assumptions.
Our main analysis considers race-specific population projections; baseline incidence by age, county, and race; and subpopulation-specific (race/ethnicity, urban/rural, income, U.S. Census region) CRFs to account for the known differences across these factors. We explored the impact of various methodological assumptions for: population projection (overall population projection vs allowing population growth to differ by race), baseline incidence (single value overall vs county-specific vs county- and age-specific), and CRF (single association for the whole population vs different CRFs by subpopulation). By combining these assumptions, we investigated how results were affected by a higher degree of methodological sophistication. Table S1 shows combinations of methodological assumptions underlying the main analysis (Main Approach) and six alternative analyses (Alternative Approach 1–6).
Economic Analyses of Health Outcomes.
The U.S. Environmental Protection Agency (EPA) Value of Statistical Life (VSL) metric was used to estimate economic impacts of death. VSL provides an estimate for the aggregate amount society is willing to pay to avoid one additional death.79 The current EPA VSL quantifying death risk reduction benefits is $11.5 million using 2024 USD adjustments to the $7.4 million 2006 EPA value.80,81 Hospital inpatient admission cost (HOSP) was estimated at $18,531 (95% CI: $10,028, $27,034) per hospitalization in 2024 USD, adjusted from 2017 USD.80,82 Economic valuation of deaths and hospitalizations is estimated as
where Δyat is the change in premature mortality avoided for subpopulation a for policy scenario t; and ΔHAat is the change in premature hospitalization for population a for policy scenario t.83,84
Inequality Metrics.
Social disparities in impacts of air pollution can have various causes. Here we focus on disparities in exposure and health response to a given level of exposure. To evaluate exposure inequality, population-weighted averaging of exposure by subgroup was used. Population-weighted average PM2.5 exposure was calculated for each subpopulation as
where Pa,j is subpopulation a in county j, and Cj is PM2.5 for county j85. This was done using 5 year ACS population counts for each subpopulation and county plus the total county population for three age groupings (18–64, 65–74, ≥ 75 years). Exposure estimates were generated for each policy scenario and subpopulation of interest and averaged for country-wide and Census region-wide values.
The use of different CRF by race, income, urban status, and region incorporates differences by subpopulation in their response to a given level of air pollution. We calculated both absolute and relative difference. Relative difference was calculated as
where Aat is the avoided death rate for subpopulation a for policy t and Bt is the overall, group specific (i.e., all income level groups combined) population avoided death rate for policy t.86,87 We chose this measure of inequality for its ability to differentiate, by percentage, from the average population thus not comparing between racial groups, while also presenting more readily interpretable differences for policy relevance.
Analyses were conducted using the R statistical program version 4.2.0.
RESULTS
Pollution Reductions.
Energy policy scenarios involving full implementation of sector-specific regulations are projected to result in overall population-weighted U.S. PM2.5 reductions in 2050 of 1.83 μg/m3 for Port, 1.89 μg/m3 for HighNG, 1.84 μg/m3 for HighEV, and 2.24 μg/m3 for HighEE, compared to 2010 modeled averages (9.08 μg/m3 U.S.-wide) (Figure 1 and Table S2). In comparison, full implementation of the BAU policy in 2050 is estimated to result in 1.83 μg/m3 reduction in PM2.5. Regionally, average ambient PM2.5 concentration changes varied greatly, with the largest reductions across scenarios observed in the Midwestern and mid-Atlantic states, with lower reductions across the western half of the U.S. (Figure 2).We analyzed how disparities in pollution levels differ among policy scenarios. On average, every subpopulation experiences the largest PM2.5 reductions under HighEE (Figure 1). Reductions were second highest under the HighNG scenario, except for the Western U.S. for which the BAU scenario projects the second highest concentration reductions. By county, HighEE has the largest PM2.5 reductions for 98% of counties (3060 of 3108 counties) (Figure S2). On the other hand, the policy with the lowest county-level PM2.5 reductions was most frequently the Port policy scenario (37.1%, 1153 counties), followed by the HighEV policy (30.1%, 937 counties), the BAU policy (25.2%, 784 counties), and the HighNG policy (7.5%, 234 counties).
Figure 1.
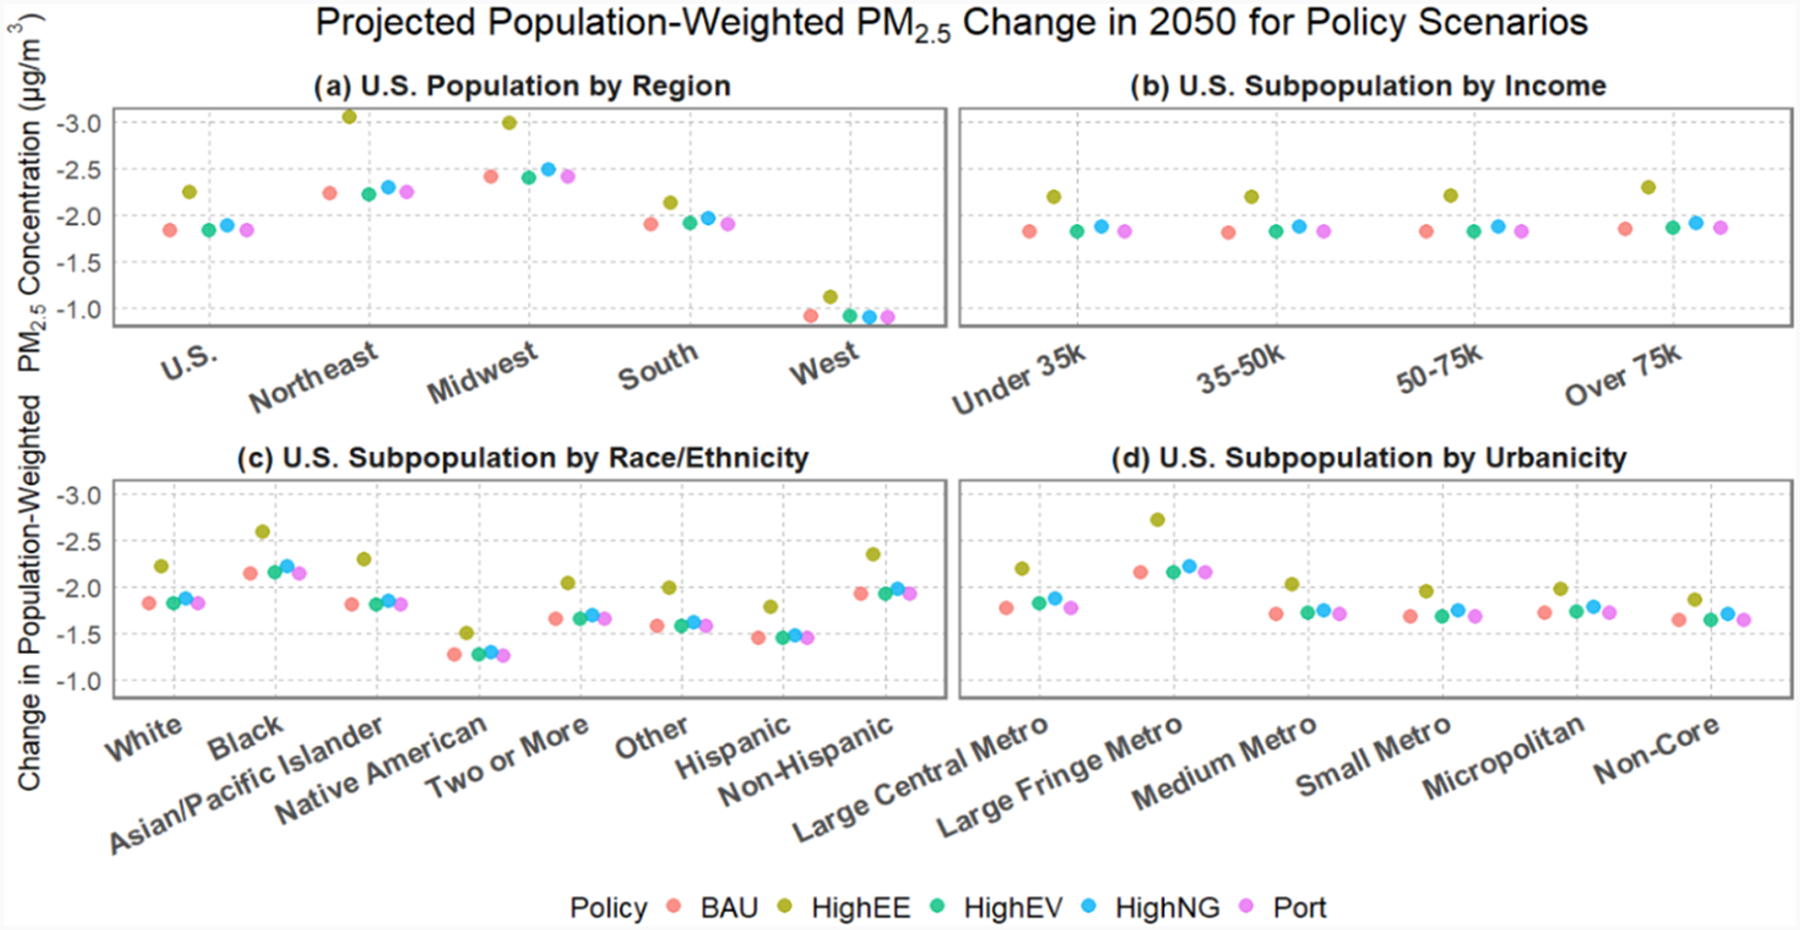
Policy-specific projected population-weighted PM2.5 concentration changes in 2050 from the 2010 reference for by (a) region, (b) income, (c) race/ethnicity, and (d) urbanicity.
Figure 2.
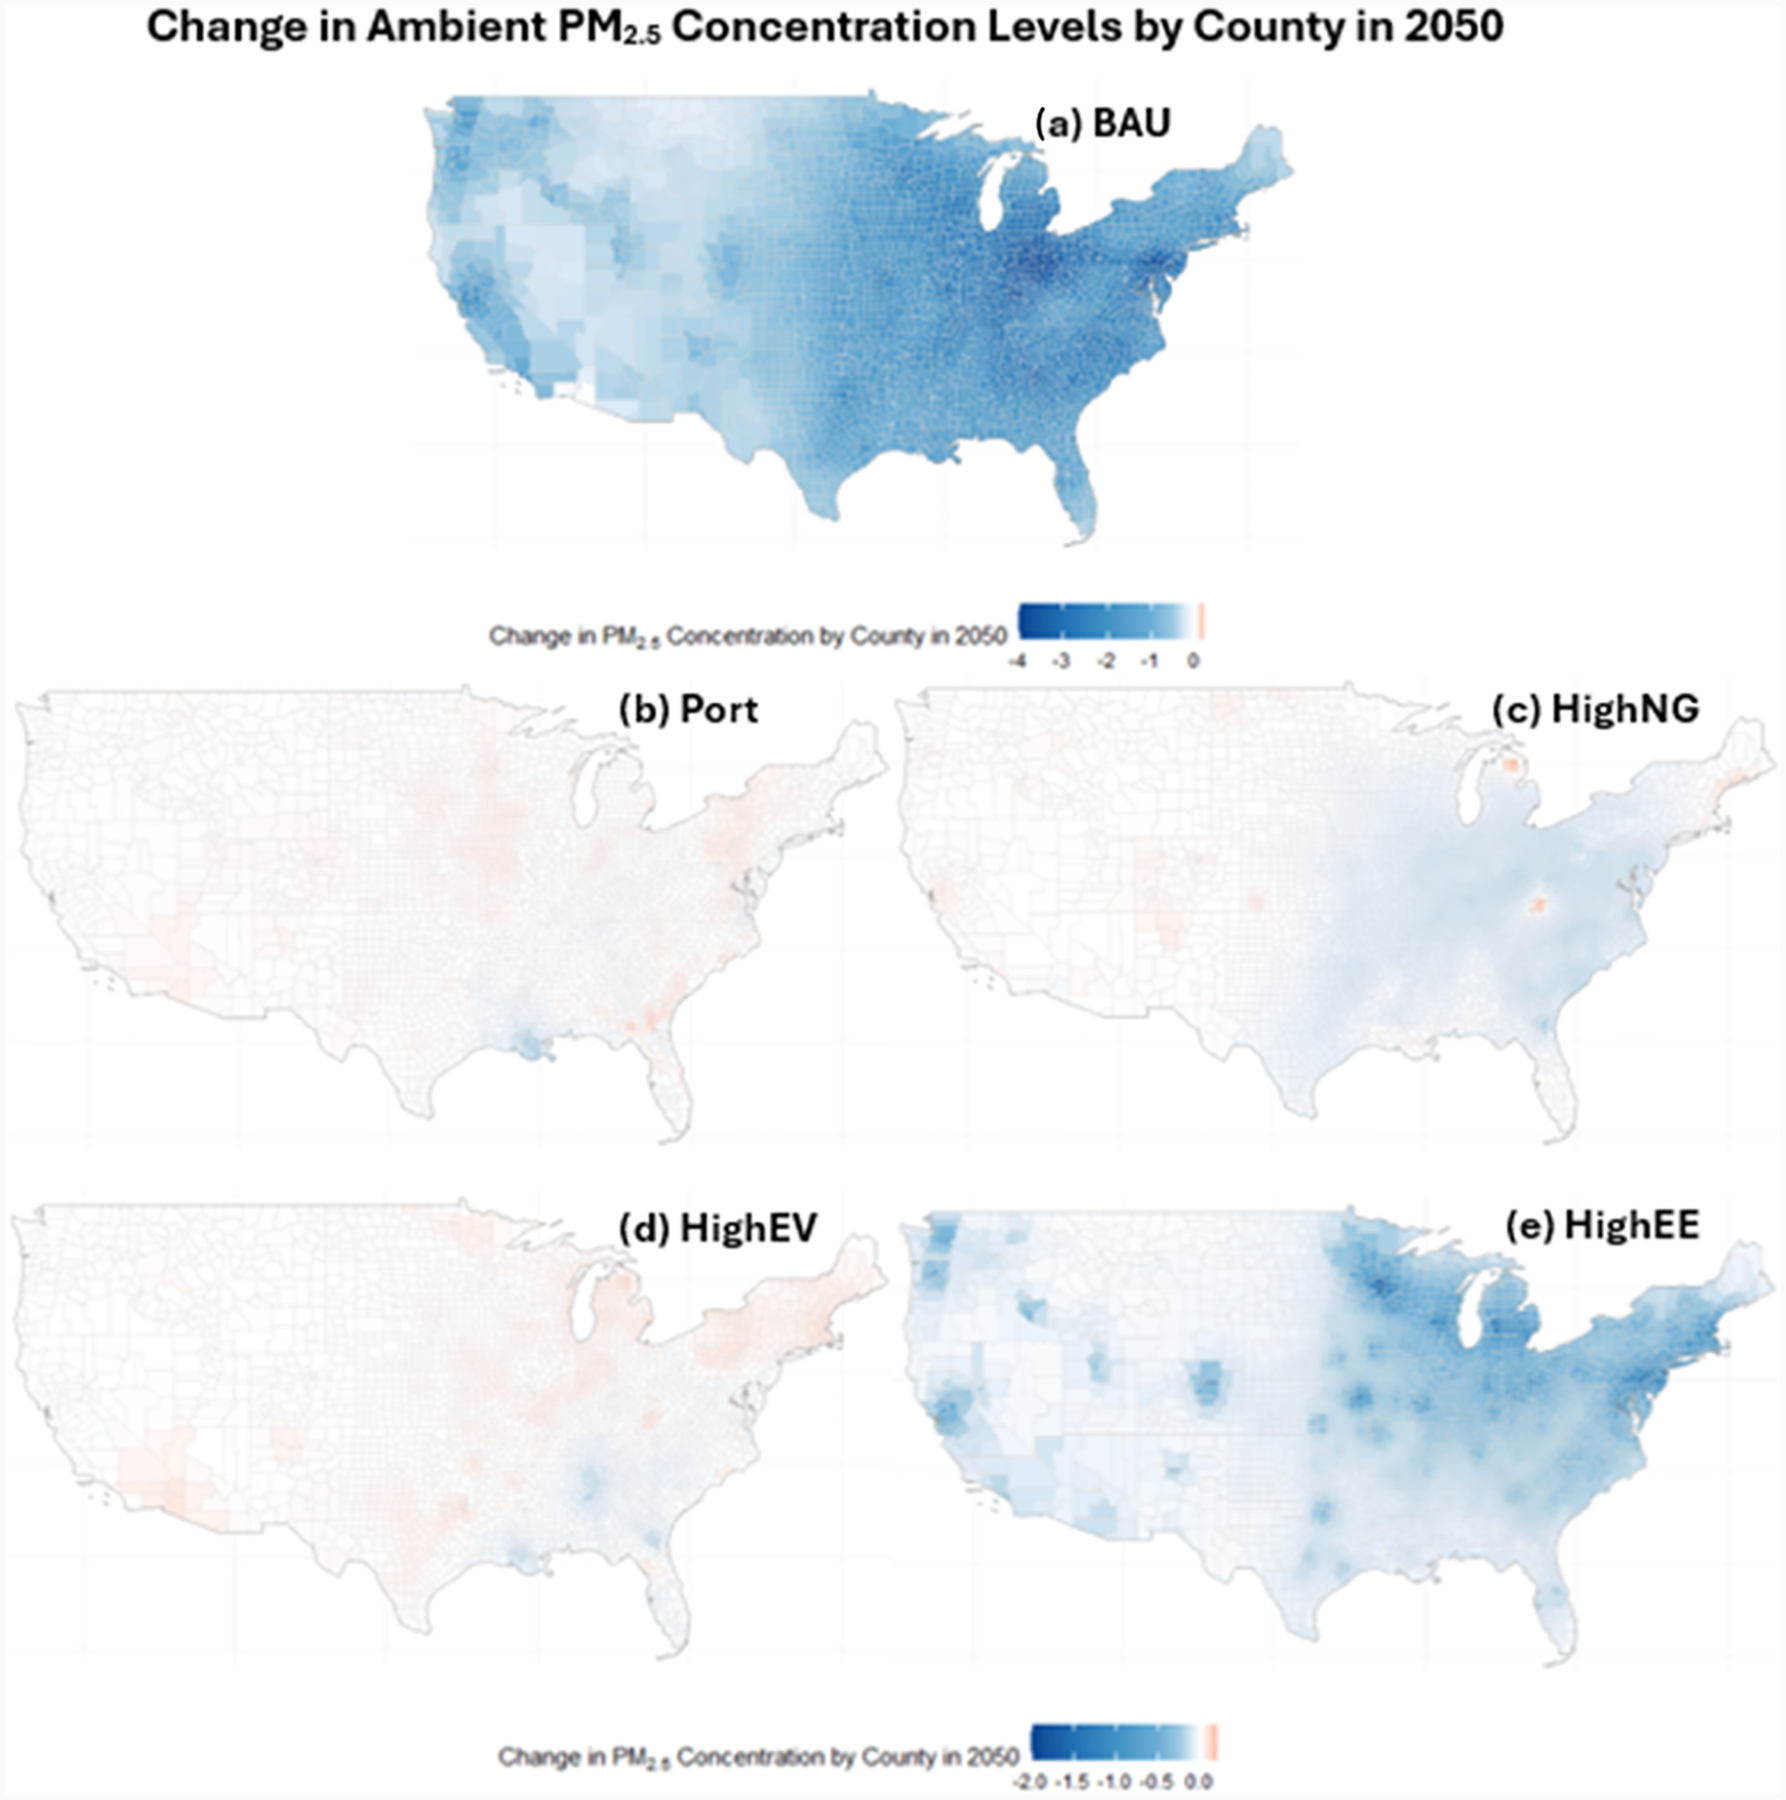
County-level ambient PM2.5 concentration changes in 2050, compared to 2010 reference concentrations, for the (a) BAU policy scenario, and the county-level ambient PM2.5 concentration changes in 2050, compared to the BAU scenario in 2050, for each sector-specific policy scenario (b) Port, (c) HighNG, (d) HighEV, and (e) HighEE. Note that (a) BAU has a different scale than (b) Port, (c) HighNG, (d) HighEV, and (e) HighEE to allow for these scenarios to better display concentration changes from the 2050 BAU scenario comparison, where blue is additional reductions from BAU and red is lower reduction than BAU.
Disparities in Pollution Levels by Subpopulations.
While the general transition toward more renewable power means that all policy scenarios reduce PM2.5 concentrations in 2050 compared to the 2010 reference scenario, some subpopulations are estimated to benefit more than others. By race/ethnicity, the Black subpopulation is projected to experience the largest PM2.5 reductions across all policy scenarios, compared to 2010 reference concentrations (Figure 1). This holds true for the contiguous U.S. and all four U.S. regions. The second largest reductions are projected for the White subpopulation averaged across the entire U.S. for each policy scenario, but this projection varies across U.S. regions (Table S2). The Asian/Pacific Islander subpopulation is projected to experience the lowest PM2.5 reduction in concentration across all policy scenarios for the Northeast and South regions, and across all policies aside from the HighEE scenario in the Midwest.
By income, the richest group (≥$75,000/year, 2020USD) is projected to experience the highest decrease in PM2.5 from every policy scenario across the U.S. and all four regions (Figure 1 and Table S2). The largest difference in overall PM2.5 reductions across income levels is for the HighEE scenario, with a difference of 0.10 μg/m3 between reductions for the highest and second to lowest ($35,000–$50,000/year) groups.
Across urban gradients, the Large Fringe Metro areas have the highest PM2.5 reductions, with Large Central Metro areas having the second highest concentration reductions across all policies (Figure 1). The most rural areas (Non-Core) are projected to experience the lowest PM2.5 reductions under each scenario.
Overall Health Benefits.
Compared to the 2010 baseline scenario, we estimate that BAU will avoid 67,011 (45,692, 82,397) deaths in 2050 across the contiguous U.S. (Table 1). When compared to the fully actualized BAU policy scenario in 2050, the Port, HighNG, HighEV, and HighEE scenarios are projected to avoid (i.e., beyond 2050 BAU projections) 65 (44, 79), 2,104 (1,442 2,577), 153 (104, 186), and 13,992 (9,594, 17,136) additional deaths in 2050, respectively (Table S2). The BAU policy scenario projects 11,577 (1,332, 19,918) fewer cardiovascular and respiratory hospitalizations across the U.S. compared to the 2010 baseline scenario (Table S4). The Port, HighNG, HighEV, and HighEE scenarios project an additional 7 (1, 11), 429 (50, 736), 22 (3, 37), and 1,976 (228, 3,385) avoided hospitalizations than the 2050 BAU projections (Table S5).
Table 1.
Projected Avoided Deaths (95% Confidence Intervals) in 2050 for Five Energy Policy Scenarios across U.S. Subpopulations (Results of the Five Energy Policy Scenario Projections in 2050 Compared to the 2010 Baseline)a
| avoided deaths for each projected policy scenario in 2050 vs 2010 baseline | |||||
|---|---|---|---|---|---|
| death co-benefits in 2050 | BAU | Port | HighNG | HighEV | HighEE |
| overall | 67,011 (45,692, 82,397) | 67,075 (45,736, 82,476) | 69,114 (47,134, 84,974) | 67,162 (45,796, 82,583) | 81,003 (55,286, 99,532) |
| Race | |||||
| White | 38,998 (27,769, 56,904) | 39,022 (27,786, 56,939) | 40,235 (28,654, 58,699) | 39,065 (27,817, 57,002) | 47,069(33,540, 68,604) |
| Black | 14,696 (5,187, 24,834) | 14,742 (5,203, 24,912) | 15,214 (5,372, 25,697) | 14,782 (5,217, 24,978) | 17,608 (6,231, 29,673) |
| Asian/Pacific Islander | 2,003 (1,624, 2,394) | 2,005 (1,625, 2,396) | 2,044 (1,658, 2,443) | 2,005 (1,625, 2,395) | 2,535 (2,057, 3,028) |
| Native American | 321 (203, 431) | 321 (203, 431) | 330 (209, 443) | 321 (203, 432) | 374 (237, 503) |
| two or more | 4,461 (−2,197, 11,371) | 4,463 (−2,198, 11,377) | 4,584 (−2,259, 11,679) | 4,468 (−2,201, 11,389) | 5,445 (−2,699, 13,824) |
| other | 2,166 (−1,429, 5,525) | 2,166 (−1,429, 5,525) | 2,215 (−1,426, 5,6446) | 2,166 (−1,429, 5,524) | 2,713 (−1,798, 6,887) |
| ethnicity | |||||
| Hispanic | 12,860 (7,414, 18,371) | 12,860 (7,414, 18,870) | 13,149 (7,582, 18,778) | 12,870 (7,420, 18,385) | 15,768 (9,110, 22,477) |
| non-Hispanic | 46,830 (−30,953, 119,226) | 46,881 (−30,987, 119,354) | 48,349 (−31,979, 123,013) | 46,945 (−31,031, 119,515) | 56,523 (−37,518, 143,333) |
| income level | |||||
| less than $35,000 | 20,509 (12,978, 26,246) | 20,536 (12,998, 26,281) | 21,185 (13,411, 27,106) | 20,568 (13,019, 26,322) | 24,480 (15,509, 31,298) |
| $35,000 to $49,999 | 10,215 (4,978, 15,019) | 10,225 (4,991, 15,034) | 10,548 (5,146, 15,503) | 10,243 (4,999, 15,060) | 12,213 (5,970, 17,624) |
| $50,000 to $74,999 | 17,926 (10,838, 26,005) | 17 941 (10,849, 26,029) | 18,495 (11,187, 26,823) | 17,968 (10,863, 26,067) | 21,511 (13,028, 31,144) |
| over $75,000 | 17,273 (0, 37,546) | 17,287 (0, 37,587) | 17,791 (0, 38,660) | 17,331 (0, 37,609) | 21,203 (0, 45,987) |
| region | |||||
| northeast | 12,173 (1,284, 22,010) | 12,178 (1,285, 22,019) | 12,509 (1,320, 22,611) | 12,108 (1,277, 21,893) | 16,352 (1,731, 29,465) |
| midwest | 41,695 (29,148, 53,169) | 41,639 (29,108, 53,097) | 43,091 (30,134, 54,932) | 41,554 (29,048, 52,990) | 50,987 (35,722, 64,887) |
| south | 24,970 (9,450, 41,310) | 25,078 (9,492, 41,490) | 25,976 (9,834, 42,961) | 25,263 (9,562, 41,793) | 27,950 (10,589, 46,191) |
| west | 4,770 (2,706, 7,235) | 4,747 (2,693, 7,200) | 4,738 (2,688, 7,186) | 4,756 (2,698, 7,214) | 5,880 (3,337, 8,913) |
| urbanicity | |||||
| large central metro | 18,669 (14,603, 23,890) | 18,674 (14,607, 23,896) | 19,135 (14,969, 24,483) | 18,692 (14,621, 23,919) | 23,388 (18,310, 29,894) |
| large fringe metro | 19,923 (15,589, 25,484) | 19,960 (15,617, 25,530) | 20,540 (16,073, 26,268) | 19,952 (15,611, 25,520) | 24,980 (9,563, 31,915) |
| medium metro | 14,986 (11,720, 19,180) | 15,002 (11,733, 19,201) | 15,464 (12,096, 19,790) | 15,051 (11,771, 19,264) | 17,698 (13,849, 22,635) |
| small metro | 6,910 (5,404, 8,845) | 6,917 (5,409, 8,854) | 7,156 (5,597, 9,158) | 6,929 (5,419, 8,869) | 7,971 (6,237, 10,197) |
| micropolitan | 5,736 (1,792, 9,886) | 5,737 (1,792, 9,889) | 5,955 (1,861, 10,261) | 5,750 (17,96, 9,910) | 6,562 (2,052, 11,296) |
| non-core | 4,157 (1,298, 7,171) | 4,161 (1,299, 7,177) | 4,320 (1,349, 7,448) | 4,167 (1,301, 7,186) | 4,686 (1,464, 8,074) |
An analogous table for hospitalizations can be found in the Supporting Table S4. Note: Positive values indicate avoided deaths; negative values indicate additional deaths.
Disparities in Health Benefits across Policies Overall and by Region.
Health benefits were calculated based on subpopulation-specific exposures, CRFs, incidence rates, and population projections as well as location-specific exposures, CRFs, and incidence rates. Due to these differences, not all U.S.-wide health benefits sum exactly when compared across subpopulations. For example, overall avoided deaths under the BAU scenario are 67,011, but 62,645 under BAU when summing the avoided deaths across all race subpopulations.
We estimate that the HighEE scenario generates the most avoided deaths and hospitalizations in 2050 for every subpopulation nationally and regionally, which is also seen across subpopulations for avoided deaths per 100,000 persons (Figure S3). For overall avoided deaths compared to BAU in 2050, results were mixed by region across the four sector-specific scenarios. The Port scenario projects to have additional avoided deaths compared to BAU for the Northeast and South regions, but fewer avoided deaths in the Midwest and South (Table S3). The HighNG and HighEV scenarios also project fewer avoided deaths in the West compared to BAU, with BAU projecting additional avoided deaths in the Northeast and Midwest compared to the HighEV scenario (Table S3).
Disparities in Health Benefits across Subgroups.
Differences in overall health benefits are projected for all sociodemographic subpopulations under all energy policies (Table S6). While absolute differences in avoided mortality rate can be found in (Table S7), relative rates are focused on for their comparability in magnitude across population groups. The Black subpopulation has the highest projected health benefits across all policies. Avoided mortalities in the Black subpopulation are estimated to be 72.3–74.5% higher than the overall U.S. population across energy policies (Table S6). All other racial/ethnic groups fare worse than the overall population average for avoided mortalities, with the Asian/Pacific Islander population projected to have 56.7–59.1% lower avoided mortality benefit than the overall population in 2050 (Table S6). The Black subpopulation is estimated to have 18.1–20.1% higher reduction of hospitalizations than the overall population average (Table S6). The Other racial subpopulation is projected to have the highest avoided hospitalization rate across racial groups, 57.6–57.8% higher than the overall population average (Table S6).
When comparing across income levels, the highest earners (>$75,000/year) project to have 39.3–40.5% lower avoided mortality benefit than the overall population. All three lower income subgroups (<$35,000, $35,000–$50,000, $50,000–$75,000/year) project to have a higher magnitude of avoided deaths and hospitalizations than the overall population across all energy policies, with the $50,000–$74,999/year group having the highest mortality benefit, at 58.0–58.6% further reduction in deaths compared to the overall U.S. population. For hospitalizations, the lowest benefit was for the highest income group and the highest benefit for the lowest income group (Table S6).
The largest difference in health benefits spans across the two most urban categories. The most urban (Large Central Metro) subpopulation projects to have 11.6–15.0% lower mortality benefits and 13.6–14.4% lower hospitalization benefits compared to overall population averages across policy scenarios. The second most urban (Large Fringe Metro) subpopulation projects the highest death and hospitalization benefits across policy scenarios (12.7–16.7% increase in avoided mortalities and 11.6–13.6% increase in avoided hospitalizations compared to the overall population) (Table S6).
Avoided Health Costs by Energy Policy.
Monetization of avoided deaths and hospitalizations across the five policy projections in 2050 indicates cost savings of $785.8 billion to $949.9 billion (Table S8). Comparing the four sector-specific policy scenarios against BAU in 2050, an additional $750 million to $164.1 billion in avoided health impacts is estimated. These cost estimations consider deaths and hospitalizations totals, not other health impacts, lost productivity, ecological impacts, or cost of implementation of energy policies.
Analysis of the Impact of Methodological Assumptions.
The calculated totals in Table 1 and S3 are based on our most detailed consideration of health response assumptions for the given sociodemographic populations of interest. This includes race-, age-, and county-specific incidence rates, race-specific CRFs, county-specific exposures, and race- and county-specific population projections.
The importance of these methodological assumptions can be observed through changes to incidence, population projections, and CRF inputs on population-wide avoided deaths projections (Figure 3). These results are most influenced by using age-tiered incidence rates, which yielded 21,598 additional projected deaths compared to overall mortality incidence (Table S9). Use of race-specific subpopulation CRF, incidence rates, and population projections also impacted the total projected avoided deaths, but to a lesser extent. Use of race-specific CRFs (Main Approach) rather than an overall CRF (Approach 1) led to 7279 fewer projected avoided deaths for the White population in the main approach, while increasing projected avoided deaths by 2742 for the Black population in the main approach (Table S9).
Figure 3.
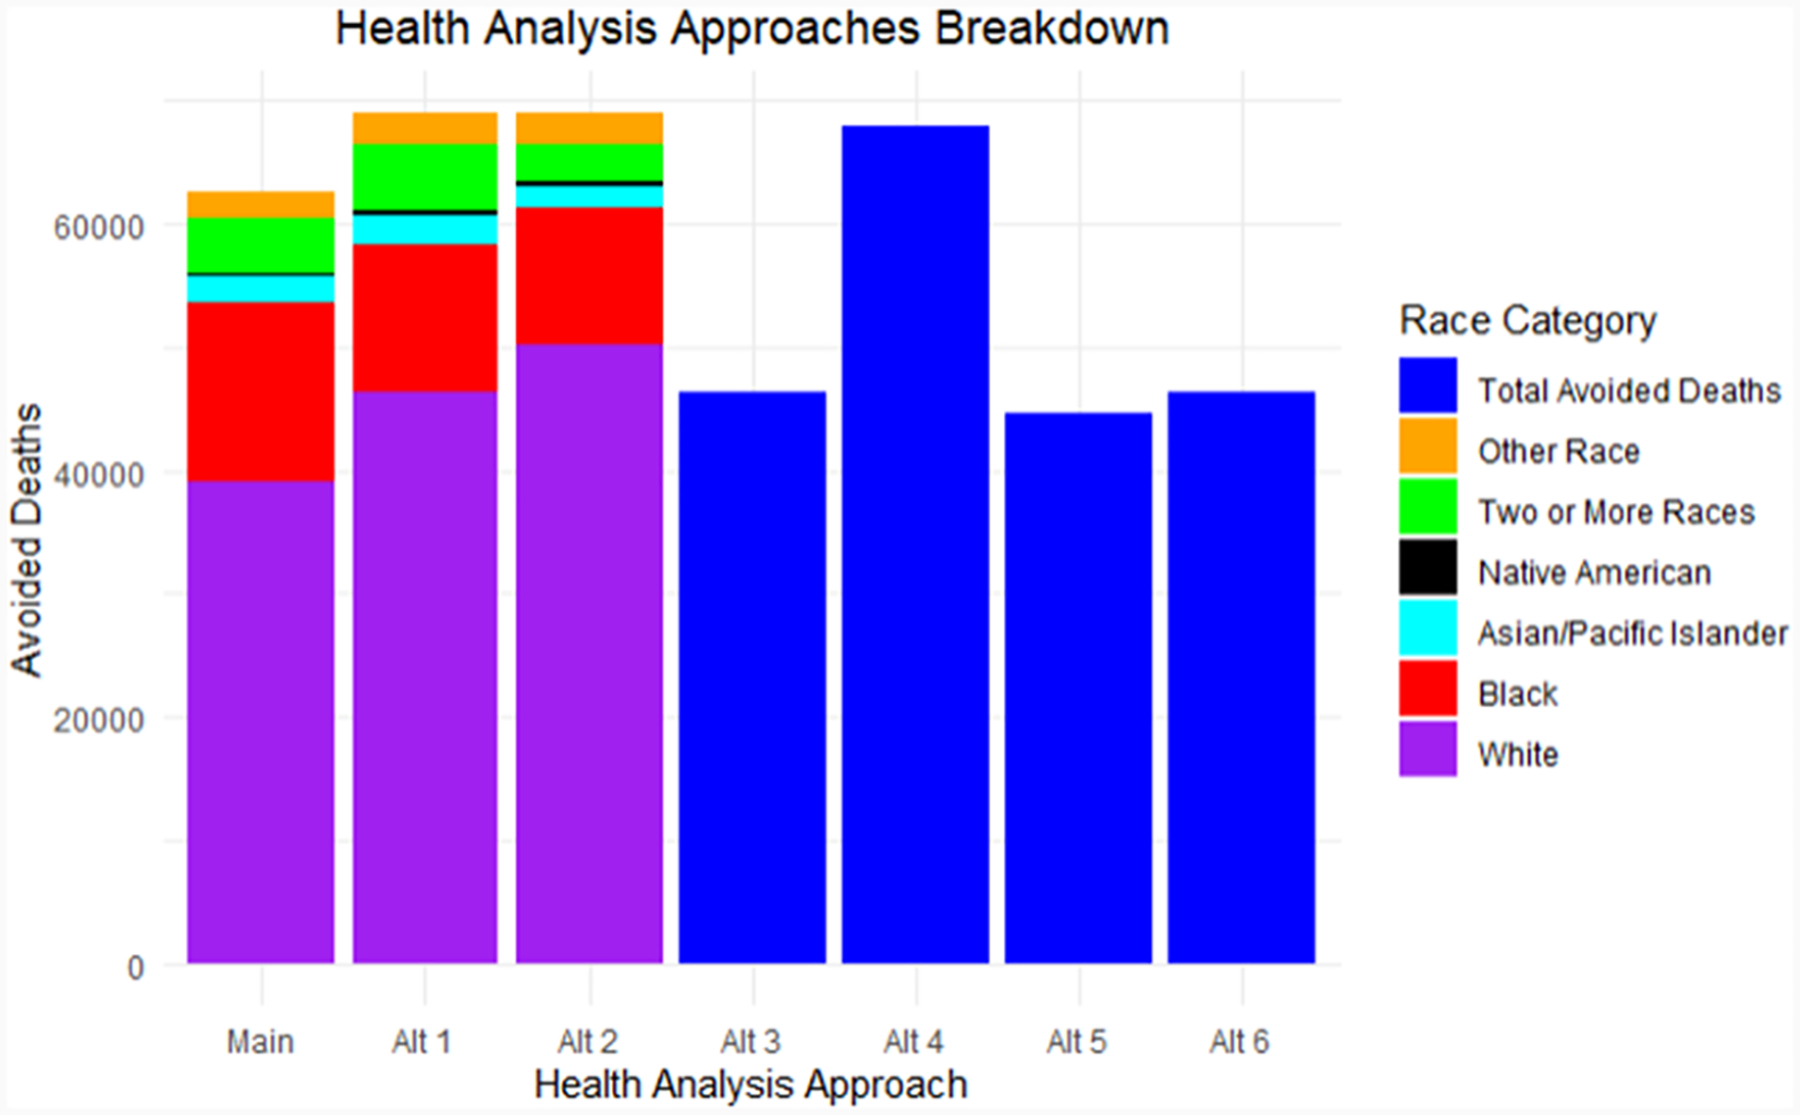
Total avoided death projections in the year 2050, compared to 2010 reference ambient PM2.5 concentrations under different methodological assumptions (assumptions detailed in Table S1). The Main Approach (Main) and Alternative Approach 1 and 2 (Alt_1 and Alt_2) include breakdowns by racial/ethnic groups, where Alternative Approaches 3–6 only include overall avoided deaths.
DISCUSSION
While many studies have investigated health cobenefits of renewable energy policies in the U.S., few focused on differential exposure and health impacts by race/ethnicity, socioeconomics, or urbanicity.42,50,52,54,86,88 The three major takeaways from our research are as follows.
Every considered future energy policy projection that transitions away from fossil fuels, including the BAU policy projected to 2050, is estimated to provide substantial exposure and health cobenefits for all populations in all regions of the U.S.
Some sociodemographic subpopulations (Black, lower income) that are considered environmental justice communities, but not all (Hispanic, Native American) were estimated to experience higher relative mortality cobenefits across energy policy projections than other communities. This indicates that the anticipated energy transition can improve environmental disparities with respect to avoided deaths due to changes in future PM2.5 exposure as well as subpopulation health vulnerabilities (mortality incidence and concentration–response rates) in some cases.
The choice of HIA model inputs, while they all involve assumptions, can influence results when investigating overall cobenefits as well as subpopulation-specific deaths, with more specificity providing better clarity into impacts on health disparities.
These general findings are particularly important given the existing disparities in air pollution exposures and associated health outcomes, combined with the need for climate change mitigation strategies.13,89 This study advances the literature by providing evidence on how different sector-specific energy policy scenarios and subsequent PM2.5 concentrations affect future exposures and health effects across the U.S. and regionally, including by subpopulation. All the considered ambitious energy policies, based on sector-specific analyses and regulatory feasibility, are estimated to improve air quality. However, which subpopulations experience the most cobenefits vary. This follows previous research findings that broader goals of reducing air pollution, improving health, and improving equity across populations would benefit from more granular analysis than simply quantifying aggregate pollution reductions.42,84,90,91
First, we found universal reduction in PM2.5 and health burden for every county across all five energy policies compared to the 2010 baseline except for a 0.02 μg/m3 PM2.5 increase under both the Port and HighEV scenarios in Yuma County, AZ, providing further evidence that climate action in the energy sector provides substantial cobenefits. The substantial cobenefits for the fully realized BAU scenario in 2050, compared to 2010 baseline emissions, highlight positive steps that have already been taken by U.S. federal and state governments. Further benefits are estimated for the sector-specific energy transition scenarios in 2050 with lower overall PM2.5 than projected 2050 BAU PM2.5 concentrations for at least one sector-specific policy in every county, indicating that most sector-specific policy projections provide additional benefit to the full actualized BAU scenario. The magnitude of PM2.5 reduction and number of avoided deaths and hospitalizations differ across counties for a given policy as well as across policies for a given county, including significant but small differences in concentration reduction across some sector-specific energy policies, such as the BAU, Port, and HighEV scenarios in the eastern U.S.
A comparison of avoided deaths between the 2050 BAU projections and the sector-specific policies highlight the extensive additional benefits of the HighEE policy. Previous research done in California and New York City corroborates these findings, showing higher total health benefits for building decarbonization over transportation decarbonization, although equity benefits prove to be more nuanced.50,54 These higher overall cobenefits are likely due to changing emissions patterns from household heating and cooling, as most U.S. households rely on fossil fuel combustion.92 Shifting to renewable sources, while reducing the amount of energy needed to provide comfortable household temperatures through more efficient HVAC systems and building envelopes, further reduces the overall emissions of fossil fuels.
Another policy-specific conclusion arises from the fact that natural gas combustion emits less particulates than other fossil combustion sources, such as coal.93 Thus, we observe the HighNG scenario was the second most beneficial U.S.-wide. The Port scenario and the HighEV scenario also both saw large health cobenefits compared to the 2010 baseline but were more like overall avoided death projections observed under the BAU scenario. Adoption of electric vehicles has been shown to provide varied air quality and health impacts globally due to cleanliness of electricity94 with U.S.-centered research showing both widespread positive effects95 and mixed effects of such adoption based on U.S. geographic location and population.96 Our research backs the previous work that has provided evidence of positive health benefits, albeit less than HighEE or HighNG cases. The smaller effect of the Port scenario, compared to the BAU scenario, is because ports are in relatively few U.S. counties, providing less overall benefit inland. However, electrification of shipping and on-site port infrastructure has shown to reduce PM2.5 concentrations from 0.3 μg/m3 in Seattle and 0.6 μg/m3 in New Jersey97 to 2.57 μg/m3 in California,98 aligning with the positive benefits we see from this transition. Significant health cobenefits were also observed in many previous studies investigating energy transitions across sectors.36,99–101
In the second set of nuanced conclusions, we found that disparities in PM2.5 reductions and health cobenefits for each energy policy varied across U.S. region and subpopulations. For instance, the Black subpopulation projects substantially higher percent avoided mortality than the overall population or other racial groups. This is due to the combination of high PM2.5 reductions, incidence rates, and CRFs compared to other racial/ethnic groups. These higher exposure, incidence, and CRF rates relate to complex interconnected environmental, social, and economic systems (e.g., historical redlining, siting of fossil fuel combustion activities), as observed in previous research.46,102
Turning to disparities among regions with different densities of population, more urban areas are projected to experience higher PM2.5 reductions compared to less urbanized areas across policy scenarios. This is expected due to the higher overall concentrations for the 2010 baseline in urban areas and concentration of many energy production activities in more urban areas.103 Interestingly, the most urbanized areas are projected to have the lowest percent avoided mortality of all six urbanicity classifications. Meanwhile, among income subpopulations, the highest group (≥$75,000/year 2020USD) is projected to experience the highest PM2.5 reductions across policies which relates to a larger proportion of these individuals in urban areas (47.9% in Large Fringe Metro compared with 29.8% in Non-Core), although they experience the lowest percent avoided deaths across income groups.
Our research indicates a range of differences in magnitude of avoided deaths and hospitalizations within a given policy scenario for every subpopulation. Large differences are found among various race/ethnicity and urbanicity groups, but only smaller differences among income subpopulations. These findings provide important insight into the relative equity of energy policies, showing that some of the most underserved populations (e.g., lower income, Black) are projected to benefit most across policies. Recent research has found similarly large differences in equity patterns by race across U.S.-focused decarbonization policy, with universal improvement in disparity for Black populations55,56 and larger general disparity for Hispanic and Asian populations.55
Third, we conducted our health analyses by incorporating the highest degree of information available by race, location, and age for population projections, baseline incidence, and CRFs, while investigating how numerous methodological assumptions in the health impact function model affected estimated health outcomes. We found that including race-specific population projections reduced overall avoided mortality projections, mainly due to lower avoided mortalities for the White population. Application of race-specific incidence rates resulted in little difference in total avoided mortality, but we found an observable difference when applying age-specific incidence rates. Alternatively, race-specific CRFs did not substantially change overall population mortality projections compared to the overall CRF, but did result in changes for estimates across racial groups specifically. Our alternative CRF projected far less avoided mortality than the main overall CRF, indicating the importance of CRF choice within health impact function models.
While most previous research used U.S.-wide CRFs that do not differentiate by subpopulation,34,50,84,104 several studies examined subpopulation granularity for incidence rates and CRF inputs.42,105 For example, Fann et al. Considered more granular assumptions of incidence rate and population growth, stratifying by 10-year and 5-year age bins, respectively.105 Another study found a substantial difference in avoided deaths for the Black population using a race-specific CRF compared to population-level CRF, which we also observed.42 Our work builds on these findings to explore how methodological assumptions can drive estimates of cobenefits in relation to CRFs, population projections, and incidence rates, as the highest level of detail can provide greater accuracy, although such information is not always available. This specificity is essential for decisionmakers who prioritize equity and justice in policymaking as it allows for fuller determination of local scale benefits by subpopulation.
This study makes several contributions, including detailed analyses on various subpopulations, real-world energy policy projections, and determination of how health model assumptions impact results. Few previous studies investigated distribution of cobenefits among subpopulations,42,50–52,88 and none, to our knowledge, have provided the level of detail of this study across race/ethnicity, income, urbanicity, and geographical region. This provides scientific evidence on how energy transition policies may differentially impact subpopulations including those known to be vulnerable to air pollution.13,15,106,107 Additionally, our findings can inform policymakers and communities regarding the benefits of energy transitions within a given location and across locations, including how different scenarios impact environmental inequality. The policies examined focus on sector-specific, politically relevant energy transitions, thereby better informing prioritizations of energy strategies and populations, focusing on improving air quality, public health, and/or equity. We investigated how different health impact model assumptions influence results, which is unaddressed by most cobenefits studies. Finally, we applied state-of-the-science air quality, climate, and energy economic modeling to generate pollution estimates and considered energy scenarios developed in collaboration with decisionmakers.
This study has several limitations. Our selection of 95%CI was done through CRF uncertainty values obtained from the literature, although the other HIA model inputs could also be used for confidence bands. While we incorporated different baseline incidences at the county level and allowed the CRF to differ by subpopulation, we did not incorporate differences by location for the CRF, although earlier work shows existence of such differences.12 Inclusion of these differing inputs also causes slight summation disparities compared to the overall avoided deaths as they incorporate different CRF rates. Further, we did not consider higher spatial resolution (e.g., neighborhood level) due to lack of available health data, finer exposure resolution, and long-term epidemiological studies that investigate such fine locational differences. Thus, our predictions of PM2.5 did not capture neighborhood-level heterogeneity. County-level data has been shown to underestimate disparities seen at a finer spatial resolution among racial and ethnic groups, thus more research is needed on greater spatial resolution to better understand subpopulation disparities.90 Since heterogeneity exists within our subpopulation categories, inclusion of other subpopulations is warranted, including additional racial/ethnic groups, persons with disabilities, people experiencing homelessness, immigrants/migrants, 2SLGBTQIA+ populations, and more.107,108 Another limitation is our PM2.5 predictions were generated using one three dimensional (3D) air quality model. While two models were used to predict PM2.5, we use only one given the results were similar. While all 3D air quality models are subject to uncertainties in their inputs, model configurations, and model representations, quantification of such uncertainties is beyond the scope of this work.
Also, our exposure projections assume a stable climate from the 2010 baseline period of comparison, and did not consider the effects of climate change on projected PM2.5 concentrations. Thus, our analysis isolates the effect of energy policy choices, not climate change. Not only are there complex interactions between suspended particles and meteorological variables that shape concentration levels, but also climateinduced factors such as increased wildfire intensity and duration that are not captured in our modeling. Wildfires specifically produce extensive PM2.5 and are projected to increase.109 We considered PM2.5 and did not address other air pollutants relevant to human health (e.g., O3),110–112 although they would likely shift from energy policy changes.32,37 Thus, our projections of avoided deaths and hospitalizations likely underestimate the health benefits from the presented energy transitions. Energy policies are shifting rapidly, and the BAU policy may not represent up-to-date emissions strategies including local efforts, which are constantly evolving. For example, the BAU scenario utilizes national and state energy commitments from 2017, whereas only Hawaii has made a 100% renewable energy commitment. An additional 22 states, along with Puerto Rico and Washington, DC, have passed laws or executive orders for some iteration of a 100% clean/renewable energy goal.113 Additional analysis is needed to explore a wider range of energy transition policies, including the implementation of multiple policies simultaneously and stronger or weaker transition scenarios under evolving policy landscapes.
To conclude, numerous studies investigating energy transitions identified substantial health cobenefits by shifting away from fossil fuels. We add further evidence on cobenefits of energy policies, finding that some subpopulations benefit more than others for all policies, although the magnitude of benefit varies. HIF modeling assumptions, such as whether race-specific incidence rate or CRF are applied, can change the specific results. However, we still found that large estimates of cobenefits are obtained regardless of what methodological assumptions are made in the health impact model. In addition, this study showed how different population groups can be disproportionately impacted by energy policy decisions across the U.S. and locally. Overall, we found that energy transition policies could contribute to addressing environmental inequity. The outcomes of this research can lead to better targeted policymaking driving energy emissions reductions in the areas of most need, both regionally and for specific U.S. populations.
Supplementary Material
The Supporting Information is available free of charge at https://pubs.acs.org/doi/10.1021/acs.est.4c14326.
Energy models used for analysis, a project flowchart, and exposure and health projections (PDF)
ACKNOWLEDGMENTS
This publication was developed under Assistance Agreement No. RD835871 awarded by the U.S. Environmental Protection Agency to Yale University. It has not been formally reviewed by EPA. The views expressed in this manuscript are solely those of the research team and do not necessarily reflect those of the Agency. EPA does not endorse any products or commercial services mentioned in this publication. Research reported in this publication was supported by the National Institute on Minority Health and Health Disparities of the National Institutes of Health under Award Numbers R01MD012769 and R01MD016054. The content is solely the responsibility of the authors and does not necessarily represent the official views of the National Institutes of Health. Additional funding includes the Yale Environmental Justice and Health Research Fellowship, the Yale Institute for Biospheric Studies Grant Program, and the EPICS Global Center (NSF grant 2330450).
Footnotes
Complete contact information is available at: https://pubs.acs.org/10.1021/acs.est.4c14326
The authors declare no competing financial interest.
Contributor Information
Rory K. Stewart, School of the Environment, Yale University, New Haven, Connecticut 06511, United States;
Honghyok Kim, School of Public Health, University of Illinois Chicago, Chicago, Illinois 60607, United States.
Hayon Michelle Choi, School of the Environment, Yale University, New Haven, Connecticut 06511, United States; Department of Environmental Health, Harvard T.H. Chan School of Public Health, Harvard University, Cambridge, Massachusetts 02138, United States.
Yimeng Song, School of the Environment, Yale University, New Haven, Connecticut 06511, United States.
Yang Zhang, College of Engineering, Northeastern University, Boston, Massachusetts 02115, United States.
Kenneth T. Gillingham, School of the Environment, Yale University, New Haven, Connecticut 06511, United States;
Daniel C. Esty, School of the Environment, Yale University, New Haven, Connecticut 06511, United States; Yale Law School, Yale University, New Haven, Connecticut 06511, United States
Benjamin F. Hobbs, Department of Environmental Health & Engineering, Johns Hopkins University, Baltimore, Maryland 21218, United States
Michelle L. Bell, School of the Environment, Yale University, New Haven, Connecticut 06511, United States
REFERENCES
- (1).Murray CJL; Aravkin AY; Zheng P; et al. Global burden of 87 risk factors in 204 countries and territories, 1990–2019: a systematic analysis for the Global Burden of Disease Study 2019. Lancet 2020, 396 (10258), 1223–1249. [DOI] [PMC free article] [PubMed] [Google Scholar]
- (2).World Health Organization. Global Health Observatory: Ambient Air Pollution Geneva 2024. https://www.who.int/data/gho/data/themes/topics/indicator-groups/indicator-group-details/GHO/ambient-air-pollution. Retrieved September 1,
- (3).Dockery DW; Pope CA; Xu X; Spengler JD; Ware JH; Fay ME; Ferrs BG; Speizer FE An Association Between Air Pollution and Mortality in Six US Cities. N. Engl. J. Med 1993, 329 (24), 1753–1759. [DOI] [PubMed] [Google Scholar]
- (4).Pope CA; Dockery DW Health Effects of Fine Particulate Air Pollution: Lines that Connect. J. Air Waste Manage. Assoc 2006, 56 (6), 709–742. [DOI] [PubMed] [Google Scholar]
- (5).Lu F; Xu D; Cheng Y; Dong S; Guo C; Jiang X; Zheg X Systematic review and meta-analysis of the adverse health effects of ambient PM2.5 and PM10 pollution in the Chinese population. Environ. Res 2015, 136, 196–204. [DOI] [PubMed] [Google Scholar]
- (6).Vodonos A; Awad YA; Schwartz J The concentration-response between long-term PM2.5 exposure and mortality; A meta-regression approach. Environ. Res 2018, 166, 677–689. [DOI] [PubMed] [Google Scholar]
- (7).Pope CA; Coleman N; Pond ZA; Burnett RT Fine particulate air pollution and human mortality: 25+ years of cohort studies. Environ. Res 2020, 183, No. 108924. [DOI] [PubMed] [Google Scholar]
- (8).Naghavi M; Ong KL; Aali A; GBD 2021 Causes of Death Collaborators; et al. Global burden of 288 causes of death and life expectancy decomposition in 204 countries and territories and 811 subnational locations, 1990–2021: a systematic analysis for the Global Burden of Disease Study 2021. Lancet 2024, 403 (10440), 2100–2132. [DOI] [PMC free article] [PubMed] [Google Scholar]
- (9).Bu X; Xie Z; Liu J; Wei L; Wang X; Chen M; Ren M Global PM2.5-attributable health burden from 1990–2017: Estimates from the Global Burden of Disease study 2017. Environ. Res 2021, 197, No. 111123. [DOI] [PubMed] [Google Scholar]
- (10).Di Q; Wang Y; Zanobetti A; Wang Y; Koutrakis P; Choirat C; Dominici F; Schwartz J Air Pollution and Mortality in the Medicare Population. N. Engl. J. Med 2017, 376 (26), 2513–2522. [DOI] [PMC free article] [PubMed] [Google Scholar]
- (11).Hayes RB; Lim C; Zhang Y; Cromar K; Shao Y; Reynolds HR; Silverman DT; Jones RR; Park Y; Jerrett M; Ahn J; Thurston GD PM2.5 air pollution and cause-specific cardiovascular disease mortality. Int. J. Epidemiol 2020, 49 (1), 25–35. [DOI] [PMC free article] [PubMed] [Google Scholar]
- (12).Pope CA; Lefler JS; Ezzati M; Higbee JD; Marshall JD; Kim SY; Bechle M; GIlliat KS; Vernon SE; Robinson AL; Burnett RT Mortality risk and fine particulate air pollution in a large, representative cohort of US adults. Environ. Health Perspect 2019, 127 (7), No. 077007. [DOI] [PMC free article] [PubMed] [Google Scholar]
- (13).Bevan GH; Freedman DA; Lee EK; Rajagopala S; Al-Kindi SG Association between ambient air pollution and county-level cardiovascular mortality in the United States by social deprivation index. Am. Heart J 2021, 235, 125–131. [DOI] [PubMed] [Google Scholar]
- (14).Šlachtová H; Vitezslav V; Tomasek I; Tomaskova H Environmental and Socioeconomic Health Inequalities: A Review and an Example of the Industrial Ostrava Region. Cent. Eur. J. Public Health 2016, 24, S26–S32. [DOI] [PubMed] [Google Scholar]
- (15).Bell ML; Zanobetti A; Dominici F Evidence on vulnerability and susceptibility to health risks associated with short-term exposure to particulate matter: a systematic review and meta-analysis. Am. J. Epidemiol 2013, 178, 865–876. [DOI] [PMC free article] [PubMed] [Google Scholar]
- (16).Van Donkelaar A; Hammer MS; Bindle L; Brauer M; Brook JR; Garay MJ; Hsu C; Kalashnikova OV; Kahn RA; Lee C; Levy RC; Lyapustin A; Sayer AM; Martin RV Monthly global estimates of fine particulate matter and their uncertainty. Environ. Sci. Technol 2021, 55 (22), 15287–15300. [DOI] [PubMed] [Google Scholar]
- (17).Chen C; Chan A; Dominici F; Peng RD; Sabath B; Di Q; Schwartz J; Bell ML Do temporal tends of associations between short-term exposure to fine particulate matter (PM2.5) and risk of hospitalizations differ by sub-populations and urbanicity – a study of 968 US counties and the Medicare population. Environ. Res 2022, 206, No. 112271. [DOI] [PMC free article] [PubMed] [Google Scholar]
- (18).Levy JI; Greco SL; Spengler JD The Importance of Population Susceptibility for Air Pollution Risk Assessment: A Case Study of Power Plants Near Washington, DC. Environ. Health Perspect 2002, 110 (12), 1253–1260. [DOI] [PMC free article] [PubMed] [Google Scholar]
- (19).Dominici F; Wang Y; Correia AW; Ezzati M; Pope CA 3rd; Dockery DW Chemical Composition of Fine Particulate Matter and Life Expectancy: In 95 US Counties Between 2002 and 2007. Epidemiology 2015, 26 (4), 556–564. [DOI] [PMC free article] [PubMed] [Google Scholar]
- (20).Krall JR; Anderson GB; Dominici F; Bell ML; Peng RD Short-term exposure to particulate matter constituents and mortality in a national study of U.S. urban communities. Environ. Health Perspect 2013, 121 (10), 1148–1153. [DOI] [PMC free article] [PubMed] [Google Scholar]
- (21).Bell ML Assessment of the health impacts of particulate matter characteristics. Res. Rep. - Health Eff. Inst 2012, No. 161, 5–38. [PubMed] [Google Scholar]
- (22).Yang Y; Ruan Z; Wang X; Yang Y; Mason TG; Lin H; Tian L Short-term and long-term exposures to fine particulate matter constituents and health: A systematic review and meta-analysis. Environ. Pollut 2019, 247, 874–882. [DOI] [PubMed] [Google Scholar]
- (23).Orru H; Ebi KL; Forsberg B The Interplay of Climate Change and Air Pollution on Health. Curr. Environ. Health Rep 2017, 4 (4), 504–513. [DOI] [PMC free article] [PubMed] [Google Scholar]
- (24).Ou Y; She W; Smith SJ; Ledna CM; West JJ; Nolte CG; Loughlin DH Estimating environmental co-benefits of U.S. low-carbon pathways using an integrated assessment model with state-level resolution. Appl. Energy. 2018, 216, 482–493. [DOI] [PMC free article] [PubMed] [Google Scholar]
- (25).Kim SE; Xie Y; Dai H; Fujimori S; Hijioka Y; Honda Y; Hashizume M; Masui T; Hasegawa T; Xu X; Yi K; Kim H Air quality co-benefits from climate mitigation for human health in South Korea. Environ. Int 2020, 136, No. 105507. [DOI] [PubMed] [Google Scholar]
- (26).Dimitrova A; Marios G; Kiesewetter G; Samir KC; Rafaj P; Tonne C Health impacts of fine particles under climate change mitigation, air quality control, and demographic change in India. Environ. Res. Lett 2021, 16 (5), No. 054025. [Google Scholar]
- (27).Kuylenstierna JCI; Heaps CG; Ahmed T; Vallack HW; Kicks WK; Ashmore MR; Malley CS; Wang G; Lefevre EL; Anenberg SC; Lacey F; Shindell DT; Bhattacharjee U; Henze DK Development of the Low Emissions Analysis Platform – Integrated Benefits Calculator (LEAP-IBC) tool to assess air quality and climate co-benefits: Application for Bangladesh. Environ. Int 2020, 145, No. 106155. [DOI] [PubMed] [Google Scholar]
- (28).Gallagher CL; Holloway T Integrating Air Quality and Public Health Benefits in U.S. Decarbonization Strategies. Front. Public Health 2020, 8, No. 563358. [DOI] [PMC free article] [PubMed] [Google Scholar]
- (29).Thompson TM; Rausch S; Saari RK; Selin NE Air quality co-benefits of subnational carbon policies. J. Air Waste Manage. Assoc 2016, 66 (10), 988–1002. [DOI] [PubMed] [Google Scholar]
- (30).West JJ; Smith SJ; Silva RA; Naik V; Zhang Y; Adelman Z; Fry MM; Anenberg S; Horowitz LW; Lamarque JF Co-benefits of Global Greenhouse Gas Mitigation for Future Air Quality and Human Health. Nat. Clim. Change 2013, 3 (10), 885–889. [DOI] [PMC free article] [PubMed] [Google Scholar]
- (31).Hess JJ; Ranadive N; Boyer C; Aleksandrowicz L; Anenberg SC; Aunan K; Belesova K; Bell ML; Bickersteth S; Bowen K; Burden M; Campbell-Lendrum D; Carlton E; Cissé G; Cohen F; Dai H; Dangour AD; Dasgupta P; Frumkin H; Gong P; Gould RJ; Haines A; Hales S; Hamilton I; Hasegawa T; Hashizume M; Honda Y; Horton DE; Karambelas A; Kim H; Kim SE; Kinney PL; Kone I; Knowlton K; Lelieveld J; Limaye VS; Liu Q; Madaniyazi L; Martinez ME; Mauzerall DL; Milner J; Neville T; Nieuwenhuijsen M; Pachauri S; Perera F; Pineo H; Remais JV; Saari RK; Sampedro J; Scheelbeek P; Schwartz J; Shindell D; Shyamsundar P; Taylor TJ; Tonne C; Van Vuuren D; Wang C; Watts N; West JJ; Wilkinson P; Wood SA; Woodcock J; Woodward A; Xie Y; Zhang Y; Ebi KL Guidelines for Modeling and Reporting Health Effects of Climate Change Mitigation Actions. Environ. Health Perspect 2020, 128 (11), No. 115001. [DOI] [PMC free article] [PubMed] [Google Scholar]
- (32).Gao J; Kovats S; Vardoulakis S; Wilkinson P; Woodward A; Li J; Gu S; Liu X; Wu H; Wang J; Song X; Zhai Y; Zhao J; Liu Q Public health co-benefits of greenhouse gas emissions reduction: A systematic review. Sci. Total Environ 2018, 627, 388–402. [DOI] [PubMed] [Google Scholar]
- (33).Markandya A; Sampedro J; Smith SJ; Van Dingenen R; Pizarro-Irizar C; Arto I; González-Eguino M Health co-benefits from air pollution and mitigation costs of the Paris Agreement: a modelling study. Lancet Planet Health 2018, 2 (3), e126–e133. [DOI] [PubMed] [Google Scholar]
- (34).Saari RK; Selin NE; Rausch S; Thompson TM A self-consistent method to assess air quality co-benefits from U.S. climate policies. J. Air Waste Manage. Assoc 2015, 65 (1), 74–89. [DOI] [PubMed] [Google Scholar]
- (35).Vandyck T; Keramidas K; Tchung-Ming S; Weitzel M; Van Dingenen R Quantifying air quality co-benefits of climate policy across sectors and regions. Clim. Change 2020, 163 (3), 1501–1517. [Google Scholar]
- (36).Xie Y; Xu M; Pu J; Pan Y; Liu X; Zhang Y; Xu S Large-scale renewable energy brings regionally disproportional air quality and health co-benefits in China. iScience 2023, 26 (8), No. 107459. [DOI] [PMC free article] [PubMed] [Google Scholar]
- (37).Huang X; Srikishnan V; Lamontagne J; Keller K; Peng WW Effects of global climate mitigation on regional air quality and health. Nat. Sustainability 2023, 6, 1054–1066. [Google Scholar]
- (38).Salimifard P; Rainbolt MV; Buonocore JJ; Lahvis M; Sousa B; Allen JG A novel method for calculating the projected health and climate co-benefits of energy savings through 2050. Build. Environ 2023, 244, No. 110618. [Google Scholar]
- (39).Zapata CB; Yang C; Yeh S; Ogden J; Kleeman MJ Low-carbon energy generates public health savings in California. Atmos. Chem. Phys 2018, 18, 4817–4830. [Google Scholar]
- (40).Zapata C; Muller N; Kleeman MJ PM2.5 co-benefits of climate change legislation part 1: California’s AB 32. Clim. Change 2013, 117, 377–379. [Google Scholar]
- (41).Jbaily A; Zhou X; Liu J; Lee TH; Kamareddine L; Verguet S; Dominici F Air pollution exposure disparities across US population and income groups. Nature 2022, 601, 228–233. [DOI] [PMC free article] [PubMed] [Google Scholar]
- (42).Spiller E; Proville J; Roy A; Muller NZ Mortality Risk from PM2.5: A Comparison of Modeling Approaches to Identify Disparities across Racial/Ethnic Groups in Policy Outcomes. Environ. Health Perspect 2021, 129 (12), No. 127004. [DOI] [PMC free article] [PubMed] [Google Scholar]
- (43).Cakmak S; Hebbern C; Cakmak JD; Vanos J The modifying effect of socioeconomic status on the relationship between traffic, air pollution and respiratory health in elementary school children. J. Environ. Manage 2016, 177, 1–8. [DOI] [PubMed] [Google Scholar]
- (44).Wang B; Eum KD; Kazemiparkouhi F; Li C; Manjourides J; Pavlu V; Suh H The impact of long-term PM2.5 exposure on specific causes of death: exposure-response curves and effect modification among 53 million U.S. Medicare beneficiaries. Environ. Health. 2020, 19, No. 20. [DOI] [PMC free article] [PubMed] [Google Scholar]
- (45).Mikati I; Benson AF; Luben TJ; Sacks JD; Richmond-Bryant J Disparities in Distribution of Particulate Matter Emission Sources by Race and Poverty Status. Am. J. Public Health 2018, 108, 480–485. [DOI] [PMC free article] [PubMed] [Google Scholar]
- (46).Nunez Y; Benavides J; Shearston JA; Krieger EM; Daouda M; Henneman LRF; McDuffie EE; Goldsmith J; Casey JA; Kioumourtzoglou MA An environmental justice analysis of air pollution emissions in the United States from 1970 to 2010. Nat. Commun 2024, 15, No. 268. [DOI] [PMC free article] [PubMed] [Google Scholar]
- (47).Tessum CW; Paolella DA; Chambliss SE; Apte JS; Hill JD; Marshall JD PM2.5 polluters disproportionately and systematically affect people of color in the United States. Sci. Adv 2021, 7 (18), No. abf4491. [DOI] [PMC free article] [PubMed] [Google Scholar]
- (48).Tessum CW; Apte JS; Goodkind AL; Muller NZ; Mullins KA; Paolella DA; Polasky S; Springer NP; Thakrar SK; Marshall JD; Hill JD Inequity in consumption of goods and services adds to racial–ethnic disparities in air pollution exposure. Proc. Natl. Acad. Sci. U.S.A 2019, 116 (13), 6001–6006. [DOI] [PMC free article] [PubMed] [Google Scholar]
- (49).Wang L; Zhong B; Vardoulakis S; Zhang F; Pilot E; Li Y; Yang L; Wang W; Krafft T Air Quality Strategies on Public Health and Health Equity in Europe—A Systematic Review. Int. J. Environ. Res. Public Health 2016, 13 (12), No. 1196. [DOI] [PMC free article] [PubMed] [Google Scholar]
- (50).Johnson S; Haney J; Cairone L; Huskey C; Kheirbek I Assessing Air Quality and Public Health Benefits of New York City’s Climate Action Plans. Environ. Sci. Technol 2020, 54 (16), 9804–9813. [DOI] [PubMed] [Google Scholar]
- (51).Kheirbek I; Haney J; Douglas S; Ito K; Matte T The contribution of motor vehicle emissions to ambient fine particulate matter public health impacts in New York City: a health burden assessment. Environ. Health 2016, 15, No. 89. [DOI] [PMC free article] [PubMed] [Google Scholar]
- (52).Raifman M; Russell AG; Skipper TN; Kinney PL Quantifying the health impacts of eliminating air pollution emissions in the City of Boston. Environ. Res. Lett 2020, 15, No. 094017. [Google Scholar]
- (53).Anderson CM; Kissel KA; Field CB; Mach KJ Climate change mitigation, air pollution, and environmental justice in California. Environ. Sci. Technol 2018, 52 (18), 10829–10838. [DOI] [PubMed] [Google Scholar]
- (54).Zhu S; Kinnon MM; Carlos-Carlos A; Davis SJ; Samuelsen S Decarbonization will lead to more equitable air quality in California. Nat. Commun 2022, 13 (1), No. 5738. [DOI] [PMC free article] [PubMed] [Google Scholar]
- (55).Polonik P; Ricke K; Reece S; Burney J Air quality equity in US climate policy. Proc. Natl. Acad. Sci. U.S.A 2023, 120 (26), No. e2217124120. [DOI] [PMC free article] [PubMed] [Google Scholar]
- (56).Gallagher CL; Holloway TUS decarbonization impacts on air quality and environmental justice. Environ. Res. Lett 2022, 17 (11), No. 114018. [Google Scholar]
- (57).Zhang W-W; Zhao B; Ding D; Sharp B; Gu Y; Xu S; Xing J; Wang S; Liou K; Rao L Co-benefits of subnationally differentiated carbon pricing policies in China: alleviation of heavy PM2.5 pollution and improvement in environmental equity. Energy Policy. 2021, 149, No. 112060. [Google Scholar]
- (58).Bell ML; Hobbs BJ; Peng RD; Esty DC Solutions to Energy, AiR, Climate, and Health; United States Environmental Protection Agency: Washington, DC; 2007. https://cfpub.epa.gov/ncer_abstracts/index.cfm/fuseaction/display.abstractDetail/abstract_id/10601/report/F. Accessed on November 4, 2024. Highlights of R835871. [Google Scholar]
- (59).Gillingham KT; Huang P Long-Run Environmental and Economic Impacts of Electrifying Waterborne Shipping in the United States. Environ. Sci. Technol 2020, 54 (16), 9824–9833. [DOI] [PubMed] [Google Scholar]
- (60).Gillingham KT; Ovaere M; Weber SM Carbon Policy and the Emissions Implications of Electric Vehicles, Journal of the Association of Environmental & Resource Economists; National Bureau of Economic Research, 2024. [Google Scholar]
- (61).Gillingham K; Huang P Is Abundant Natural Gas a Bridge to a Low-carbon Future or a Dead-end? Energy J. 2019, 40 (2), 75–100. [Google Scholar]
- (62).Gillingham KT; Huang P; Buehler C; Peccia J; Gentner DR The climate and health benefits from intensive building energy efficiency improvements. Sci. Adv 2021, 7 (34), No. eabg0947. [DOI] [PMC free article] [PubMed] [Google Scholar]
- (63).U.S. Energy Information Agency. Assumptions to the Annual Energy Outlook 2017, 2022. https://www.eia.gov/outlooks/aeo/assumptions/pdf/0554(2017).pdf. Washington, DC: Accessed on July 15, 2022. [Google Scholar]
- (64).Wang S; Fisher EB; Feng L; Zhong X; Ellis JH; Hobbs BF Linking energy sector and air quality models through downscaling: Long-run siting of electricity generators to account for spatial variability and technological innovation. Sci. Total Environ 2021, 772 (10), No. 145504. [DOI] [PubMed] [Google Scholar]
- (65).Zhang Y; Wang K; Schuch D Projecting Future Air Quality Under Energy Transition Scenarios over the U.S. using Online-Coupled Models EGU General Assembly 2021, EGU21–16488, 2021. [Google Scholar]
- (66).Wang K; Zhang Y; Yahya K Decadal application of WRF/Chem over the continental U.S.: Simulation design, sensitivity simulations, and climatological model evaluation. Atmos. Environ 2021, 253, No. 118331. [Google Scholar]
- (67).U.S. Census Bureau Demographic and Housing. American Community Survey 5-Year Estimates Subject Tables, Table DP05 2022. https://data.census.gov/table/ACSDP5Y2020.DP05?q=DP05. accessed on May 23, 2022.
- (68).Ingram DD; Franco SJ 2013 NCHS Urban–Rural Classification Scheme for Counties. In National Center for Health Statistics. Vital Health Stat 2; U.s Department of Health and Human Services, 2014; pp 1–73. [PubMed] [Google Scholar]
- (69).U.S. Census. Projected Race and Hispanic Origin: Main Projections Series for the United States, 2017–2060 U.S. Census Bureau, Population Division: Washington, DC; 2017. [Google Scholar]
- (70).CDC Wonder. Centers for Disease Control and Prevention 2023. http://wonder.cdc.gov/. Accessed on August 1, 2023.
- (71).Healthcare Cost and Utilization Project (HCUP) 2000–2019, MD; Agency for Healthcare Research and QualityRockville: HCUP National Inpatient Sample (NIS), 2023. www.hcup-us.ahrq.gov/nisoverview.jsp. Accessed on June 2 2019. [Google Scholar]
- (72).Makar M; Antonelli J; Di Q; Culter D; Schwartz J; Dominici F Estimating the Causal Effect of Fine Particulate Matter Levels on Death and Hospitalization: Are Levels Below the Safety Standards Harmful? Epidemiology 2017, 28 (5), 627–634. [DOI] [PMC free article] [PubMed] [Google Scholar]
- (73).Hubbell B; Fann N; Levy JI Methodological considerations in developing local-scale health impact assessments: balancing national, regional, and local data. Air Qual., Atmos. Health 2009, 2, 99–110. [Google Scholar]
- (74).Fong KC; Bell ML Do fine particulate air pollution (PM2.5) exposure and its attributable premature mortality differ for immigrants compared to those born in the United States? Environ. Res 2021, 196, No. 110387. [DOI] [PMC free article] [PubMed] [Google Scholar]
- (75).Sujaritpong S; Dear K; Cope M; Walsh S; Kjellstrom T Quantifying the health impacts of air pollution under a changing climate – a review of approaches and methodology. Int. J. Biometeorol 2014, 58, 149–160. [DOI] [PMC free article] [PubMed] [Google Scholar]
- (76).Schwartz JD; Lee M; Kinney PL; Yang S; Mills D; Sarofim MC; Jones R; Streeter R; Juliana AS; Peers J; Horton RM Projections of temperature-attributable premature deaths in 209 U.S. cities using a cluster-based Poisson approach. Environ. Health. 2015, 14, No. 85, DOI: 10.1186/s12940-015-0071-2. [DOI] [PMC free article] [PubMed] [Google Scholar]
- (77).Hong C; Zhang Q; Zhang Y; Davis SJ; Tong D; Zheng Y; Liu Z; Guan D; He K; Schellnhuber HJ Impacts of climate change on future air quality and human health in China. Proc. Natl. Acad. Sci. U.S.A 2019, 116 (35), 17193–17200. [DOI] [PMC free article] [PubMed] [Google Scholar]
- (78).Martenies SE; Wilkins D; Batterman SA Health impact metrics for air pollution management strategies. Environ. Int 2015, 85, 84–95. [DOI] [PMC free article] [PubMed] [Google Scholar]
- (79).Sacks JD; Lloyd JM; Zhu Y; Anderton J; Jang CJ; Hubbell B; Fann N The Environmental Benefits Mapping and Analysis Program - Community Edition (BenMAP-CE): A tool to estimate the health and economic benefits of reducing air pollution. Environ. Model Software 2018, 104, 118–129. [PMC free article] [PubMed] [Google Scholar]
- (80).Bureau of Labor Statistics, U.S.. Department of Labor, CPI Inflation Calculator 2024. https://data.bls.gov/cgi-bin/cpicalc.pl. Accessed on July 10, 2024.
- (81).U.S. Environmental Protection Agency. Mortality Risk Valuation 2024. https://www.epa.gov/environmental-economics/mortality-risk-valuation. Accessed on July 10, 2024.
- (82).Saenger PM; Ornstein KA; Garrido MM; Lubetsky S; Bollens-Lund E; DeCherrie LV; Leff B; Siu AL; Federman AD Cost of home hospitalization versus inpatient hospitalization inclusive of a 30-day post-acute period. J. Am. Geriatr Soc 2022, 70 (5), 1374–1383. [DOI] [PMC free article] [PubMed] [Google Scholar]
- (83).Cui L; Zhou J; Peng X; Ruan S; Zhang Y Analyses of air pollution control measures and co-benefits in the heavily air-polluted Jinan city of China, 2013–2017. Sci. Rep 2020, 10 (1), No. 5423. [DOI] [PMC free article] [PubMed] [Google Scholar]
- (84).Fann N; Fulcher CM; Hubbell BJ The influence of local, source, and emission type in estimates of the human health benefits of reducing a ton of air pollution. Air Qual., Atmos. Health 2009, 2, 169–176. [DOI] [PMC free article] [PubMed] [Google Scholar]
- (85).Ivy D; Mulholland JA; Russell AG Development of Ambient Air Quality Population-Weighted Metrics for Use in Time-Series Health Studies. J. Air Waste Manage. Assoc 2008, 58 (5), 711–720. [DOI] [PMC free article] [PubMed] [Google Scholar]
- (86).Li Y; Kumar A; Hamilton S; Lea JD; Harvey J; Kleeman MJ Optimized environmental justice calculations for air pollution disparities in Southern California. Heliyon 2022, 8 (10), No. e10732. [DOI] [PMC free article] [PubMed] [Google Scholar]
- (87).Keppel K; Pamuk E; Lynch J; Carter-Pokras O; Kim I; Mays V; Pearcy J; Shoenbach V; Weissman JS Methodological issues in measuring health disparities. Vital Health Stat. 2005, 2 (141), 1–16. [PMC free article] [PubMed] [Google Scholar]
- (88).Yang H; Huang X; Westervelt DM; Horowitz L; Peng W Socio-demographic factors shaping the future global health burden from air pollution. Nat. Sustainability 2023, 6, 58–68. [Google Scholar]
- (89).Coomes KE; Buonocore JJ; Levy JI; Arter C; Arunachalam S; Buckley L; Berberian A; Gunasti J; Perera F Assessment of the health benefits to children of a transportation climate policy in New York City. Environ. Res 2022, 215 (3), No. 114165. [DOI] [PubMed] [Google Scholar]
- (90).Paolella DA; Tessum CW; Adams PJ; Apte JS; Chambliss S; Hill JD; Muller NZ; Marshall JD Effect of model spatial resolution on estimates of fine particulate matter exposure and exposure disparities in the United States. Environ. Sci. Technol. Lett 2018, 5 (7), 436–441. [Google Scholar]
- (91).Sergi BJ; Adams PJ; Muller NZ; Robinson AL; Davis SJ; Marshall JD; Azevedo IL Optimizing Emissions Reductions from the U.S. Power Sector for Climate and Health Benefits. Environ. Sci. Technol 2020, 54 (12), 7513–7523. [DOI] [PubMed] [Google Scholar]
- (92).U.S. Energy Information Administration. 2020. Residential Energy Consumption Survey Data. https://www.eia.gov/consumption/residential/data/2020/. Accessed on September 9, 2024.
- (93).Gaffney JS; Marley NA The impacts of combustion emissions on air quality and climate – From coal to biofuels and beyond. Atmos. Environ 2009, 43 (1), 23–36. [Google Scholar]
- (94).Sharma A; Shiwang J; Lee A; Peng W Equity implications of electric vehicles: a systematic review on the spatial distribution of emission, air pollution, and health impacts. Environ. Res. Lett 2023, 18 (5), No. 053001. [Google Scholar]
- (95).Choma EF; Evans JS; Hammitt JK; Gomez-Ibanez JA; Spengler JD Assessing the health impacts of electric vehicles through air pollution in the United States. Environ. Int 2020, 144, No. 106015. [DOI] [PubMed] [Google Scholar]
- (96).Holland SP; Mansur ET; Muller NZ; Yates AJ Distributional effects of air pollution from electric vehicle adoption. J. Assoc. Environ. Resour. Econ 2019, 6 (S1), S65–S94. [Google Scholar]
- (97).Meng Z; Comer B Electrifying Ports to Reduce Diesel Pollution from Ships and Trucks and Benefit Public Health: Case Studies of the Port of Seattle and the Port of New York and New Jersey; International Council on Clean Transportation, 2023. https://theicct.org/wp-content/uploads/2023/02/Ports-electrification-US_final.pdf. [Google Scholar]
- (98).Zhu S; MacKinnon M; Soukup J; Paradise A; Dabdub D; Samuelsen S Assessment of the greenhouse gas, episodic air quality and public health benefits of fuel cell electrification of a major port complex. Atmos. Environ 2022, 275, No. 118996. [Google Scholar]
- (99).Mo H; Jiang K; Wang P; Shao M; Wang X Co-Benefits of Energy Structure Transformation and Pollution Control for Air Quality and Public Health until 2050 in Guangdong, China. Int. J. Environ. Res. Public Health. 2022, 19 (22), No. 14965. [DOI] [PMC free article] [PubMed] [Google Scholar]
- (100).Wells CD; Kasoar M; Ezzati M; Voulgarakis A Significant human health co-benefits of mitigating African emissions. Atmos Chem. Phys 2024, 24 (2), 1025–1039. [DOI] [PMC free article] [PubMed] [Google Scholar]
- (101).Chen YR; Lee WC; Liu BC; Yang BC; Ho CC; Hwang JS; Huang TH; Lin HH; Lo WC Quantifying the potential effects of air pollution reduction on population health and health expenditure in Taiwan. Environ. Pollut 2023, 336, No. 122405. [DOI] [PubMed] [Google Scholar]
- (102).Castro E; Liu A; Wei Y; Kosheleva A; Schwartz J Modification of the PM2.5- and extreme heat-mortality relationships by historical redlining: a case-crossover study in thirteen U.S. states. Environ. Health. 2024, 23 (1), No. 16. [DOI] [PMC free article] [PubMed] [Google Scholar]
- (103).Strosnider H; Kennedy C; Monti M; Yip F Rural and Urban Differences in Air Quality, 2008–2012, and Community Drinking Water Quality, 2010–2015—United States. MMWR Surveill. Summ 2017, 66 (13), 1–10. [DOI] [PMC free article] [PubMed] [Google Scholar]
- (104).Abel DW; Holloway T; Martínez-Santos J; Harkey M; Tao M; Kubes C; Hayes S Air Quality-Related Health Benefits of Energy Efficiency in the United States. Environ. Sci. Technol 2019, 53 (7), 3987–3998. [DOI] [PubMed] [Google Scholar]
- (105).Fann N; Coffman E; Timin B; Kelly JT The estimated change in the level and distribution of PM2.5-attributable health impacts in the United States: 2005–2014. Environ. Research. 2018, 167, 506–514. [DOI] [PMC free article] [PubMed] [Google Scholar]
- (106).Chi GC; Hajat A; Bird CE; Cullen MR; Griffin BA; Miller KA; Shih RA; Stefanick ML; Vedal S; Whitsel EA; Kaufman JD Individual and Neighborhood Socioeconomic Status and the Association between Air Pollution and Cardiovascular Disease. Environ. Health Perspect 2016, 124 (12), 1840–1847. [DOI] [PMC free article] [PubMed] [Google Scholar]
- (107).Goldsmith L; Bell ML Queering Environmental Justice: Unequal Environmental Health Burden on the LGBTQ+ Community. Am. J. Public Health 2022, 112 (1), 79–87. [DOI] [PMC free article] [PubMed] [Google Scholar]
- (108).DeMarco AL; Hardenbrook R; Rose J; Mendoza DL Air Pollution-Related Health Impacts on Individuals Experiencing Homelessness: Environmental Justice and Health Vulnerability in Salt Lake County, Utah. Int. J. Environ. Res. Public Health 2020, 17 (22), No. 8413. [DOI] [PMC free article] [PubMed] [Google Scholar]
- (109).Xu R; Yu P; Abramson MJ; Johnston FH; Samet JM; Bell ML; Haines A; Ebi KL; Li S; Guo Y Wildfires, global climate change, and human health. N. Engl. J. Med 2020, 383, 2173–2181. [DOI] [PubMed] [Google Scholar]
- (110).Xu R; Wang Q; Wei J; Lu R; Wang R; Liu T; Wang Y; Fan Y; Li Y; Xu L; Shi C; Li G; Chen G; Zhang L; Zhou Y; Liu Y; Sun H Association of short-term exposure to ambient air pollution with mortality from ischemic and hemorrhagic stroke. Eur. J. Neurol 2022, 29 (7), 1994–2005. [DOI] [PubMed] [Google Scholar]
- (111).Linares C; Falcon I; Ortiz C; Diaz J An approach estimating the short-term effect of NO2 on daily mortality in Spanish cities. Environ. Int 2018, 116, 18–28. [DOI] [PubMed] [Google Scholar]
- (112).Bell ML; McDermott A; Zeger SL; Samet JM; Dominici F Ozone and short-term mortality in 95 US urban communities, 1987–2000. JAMA 2004, 292 (19), 2372–2378. [DOI] [PMC free article] [PubMed] [Google Scholar]
- (113).Guide to 100% Clean Energy States; Clean Energy States Alliance. https://www.cesa.org/projects/100-clean-energy-collaborative/guide/state-monitoring-reporting-verification-mrv-procedures/. Accessed on July 1, 2024. [Google Scholar]
Associated Data
This section collects any data citations, data availability statements, or supplementary materials included in this article.