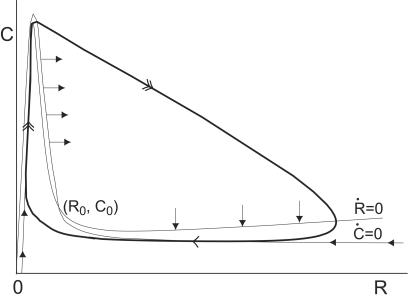
Figure 4.
Phase portrait of the two variable oscillator Eq. [2] for the parameter values given in the caption for Fig. 1 (the drawing is not to scale). The thick line illustrates the trajectory of system. (R0,C0) is the fixed point of the system, and Ṙ dR/dt = 0 and Ċ dC/dt = 0 are the R and C nullclines, respectively. The solid arrows give the orientation of the direction field on the nullclines.

