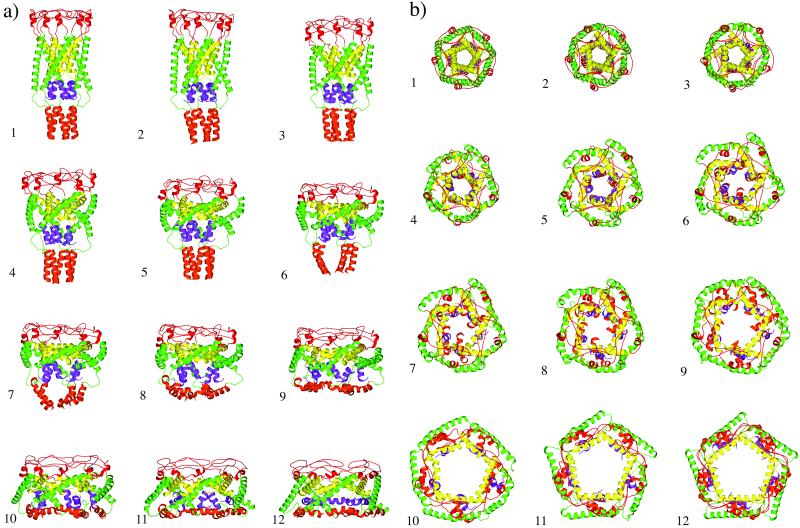
Figure 3.
Conformational transition pathway determined by TMD method, side view (a) and top view (b). The snapshots are chosen at equal time intervals, except 7, which is a half-interval insertion (also see the x axis of Fig. 5). Snapshots 1 and 12 are modeled structures in the closed and open forms, respectively.

