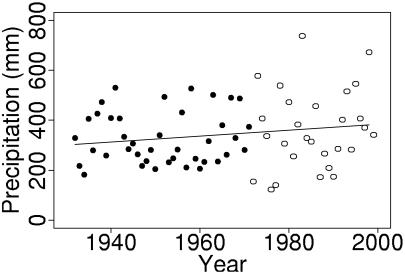
Figure 2.
Precipitation at San Jose. The points are growing season (October–April) precipitation, recorded during 1932–1998 and archived at the National Climatic Data Center, http://www.ncdc.noaa.gov/ol/climate/stationlocator.html. Data before and after 1971 are plotted with different symbols: ●, 1932–1971; ○, 1972–1998. The solid line is the least squares linear trend; slope = 1.18 mm/year, P = 0.15.

