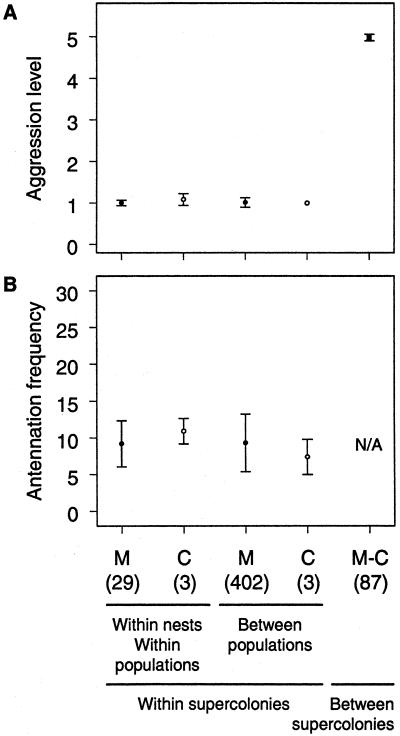
Figure 2.
Results of behavioral tests within and across populations. M and C denote populations assigned to the main and Catalonian supercolony, respectively. Sample size in number of population pairs is given in parentheses. (A) Average maximum aggression level: 0 = ignore; 1 = antennation; 2 = avoidance; 3 = dorsal flexion; 4 = aggression; 5 = fight. (B) Average antennation frequency for pairs within the same supercolony. Bars show SD.

