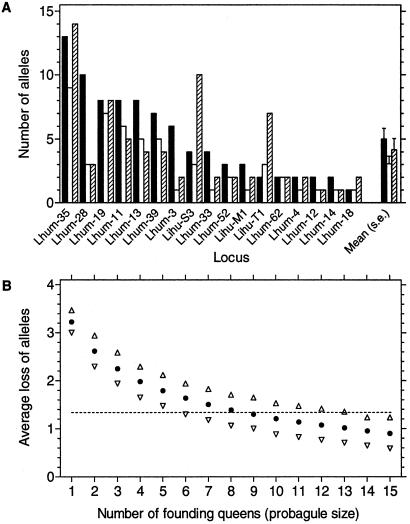
Figure 3.
(A) Genetic diversity measured as number of alleles at 17 microsatellite loci in an Argentinean reference population (filled bars) compared with a population of the main supercolony (open bars) and the Catalonian supercolony (hatched bars). Sample size is 60 workers for all loci and populations. Five additional loci with no variation in the present sample are not included. The introduced populations hold significantly fewer alleles than the native population (two-way ANOVA with locus and population type as factors; population type F1,17 = 7.4, P = 0.014). Introduced populations harbored no alleles that were not present in this or other native populations studied. (B) Average number of alleles lost across loci in 2,000 simulations of a genetic bottleneck by a limited number of founding queens taken from the native reference population (each queen representing three haploid genomes caused by mating). Open triangles give the 95% confidence intervals. The horizontal line shows the observed reduction in allele number (see A). The simulated reduction is conservative (i.e., possibly downward biased) as it is assumed that no alleles in the founding generation are subsequently lost from the new population or from other populations descending from this first population introduced.

