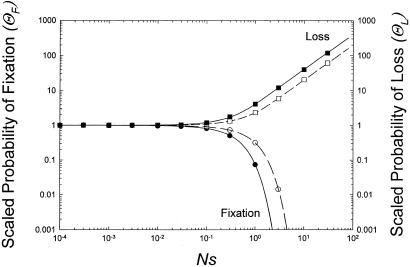
Figure 1.
Scaled probabilities of establishment (left axis, and lower curves) and loss (right axis, and upper curves) of introns in diploid (filled points and solid lines) and haploid populations (open points and dashed lines). The curved lines are the theoretical results outlined in the text, whereas the plotted values are results from computer simulations. For this particular set of simulations, n = 10−5 and s = 10−6.

