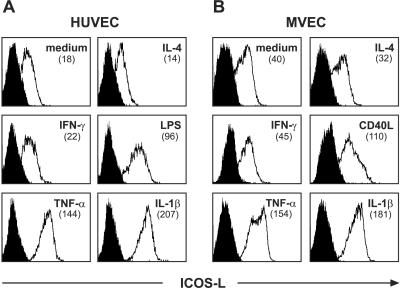
Figure 2.
Expression of ICOS-L by EC. HUVEC (A) or MVEC (B) were left untreated or were treated with the indicated reagents or with the CD40L transfectant P3xTB.A7 for 24 h, and ICOS-L expression was measured by flow cytometry by using PE-conjugated mAb HIL-131. Filled profiles represent cold blocking controls. In contrast to the CD40L transfectant, wild-type cells did not influence ICOS-L expression (data not shown). The numbers in brackets indicate the mean fluorescence intensity. One representative experiment of three is shown.

