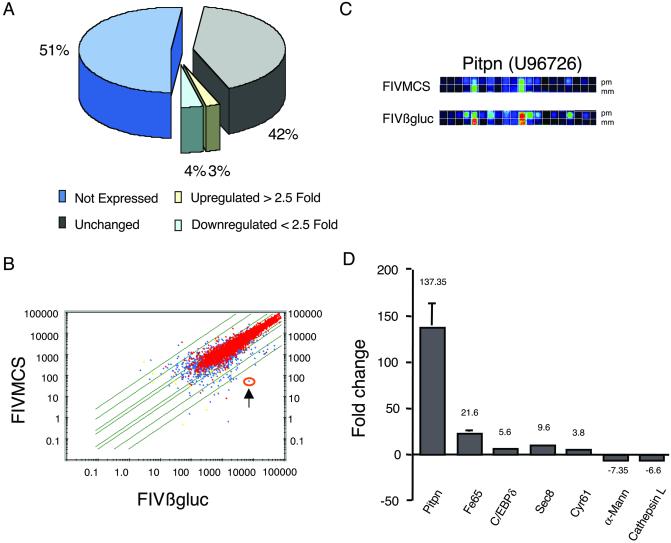
Figure 4.
Microarray analysis of murine hippocampus after treatment with FIV vectors. Hippocampi from FIVMCS- and FIVβgluc-treated animals were extracted 8 weeks after injection, and gene expression was analyzed on Affymetrix high-density oligonucleotide arrays. (A) A representation of the effects of FIVβgluc gene transfer on gene expression in the hippocampus. (B) A scatter plot depicts the average difference distribution of all genes examined, comparing FIVMCS with FIVβgluc samples. Red points depict genes that are called present, whereas blue points represent genes changing from absent to present or vice versa. Green lines indicate the magnitude of change with intervals of 2, 10, and 30-fold relative to baseline. One gene of interest, Pitpn (U96726), is circled in orange (arrow) and exhibits a significant change in gene expression as depicted by differences in the raw data images (C). (C) The increase in selective binding to the perfect match (pm) vs. the mismatch (mm) probes. (D) The increase or decrease in fold expression of RNA specific to selected genes from FIVβgluc relative to FIVMCS-treated mice. Data normalization and analyses were completed by using algorithms in the Affymetrix Microrarray Analysis suite and Data Mining Tools and significance analysis of microarrays (27).

