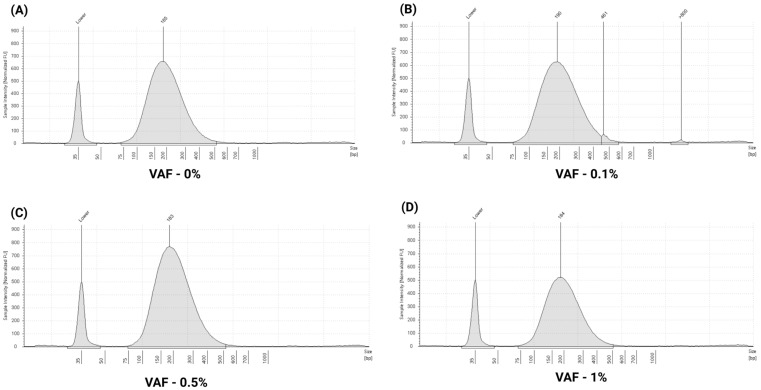
Figure 5.
Representative TapeStation electropherogram profiles of multi-analyte ctDNA plasma control: electropherogram peaks illustrating cfDNA fragment size distributions across different VAF: (A) 185 bp (VAF—0%), (B) 190 bp (VAF—0.1%), (C) 183 bp (VAF—0.5%), and (D) 184 bp (VAF—1%). All profiles show well-defined cfDNA peaks with no gDNA contamination, as indicated by the absence or minimal signal above 800 bp.

