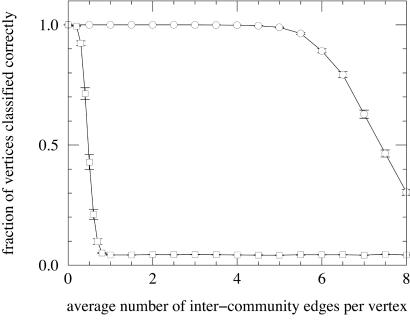
Figure 3.
The fraction of vertices correctly classified in computer-generated graphs of the type described in the text, as the average number of intercommunity edges per vertex is varied. The circles are results for the method presented in this article; the squares are for a standard hierarchical clustering calculation based on numbers of edge-independent paths between vertices. Each point is an average over 100 realizations of the graphs. Lines between points are included solely as a guide to the eye.

