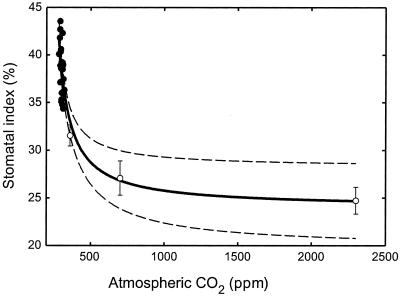
Figure 1.
Response of frond SI of the subtropical fern S. palustris to historical increases in atmospheric CO2 (●) between 1837 AD and 1964 AD, and to different experimental growth CO2 concentrations (○). The solid black line represents the nonlinear regression curve fitted to the experimental data {r2 = 0.76, P < 0.0001; SI = (24.8996 × [CO2 concentration, ppmv] − 4053.26)/([CO2 concentration, ppm]) − 211.504}. Broken curves indicate ± the 95% confidence limits. Values are means ± 1 SE.

