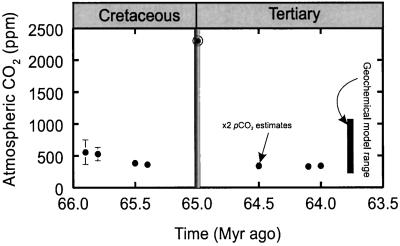
Figure 2.
Reconstructed atmospheric CO2 variations during the Late Cretaceous–Early Tertiary dervied from the SI of fossil leaf cuticles calibrated by using inverse regression and stomatal ratios (see Table 1). Values are means ± 1 SE. The KTB estimate (○), derived from fossil ferns, represents a minimum value. The vertical bar indicates the CO2 range predicted from geochemical modeling of the long-term carbon cycle (17).

