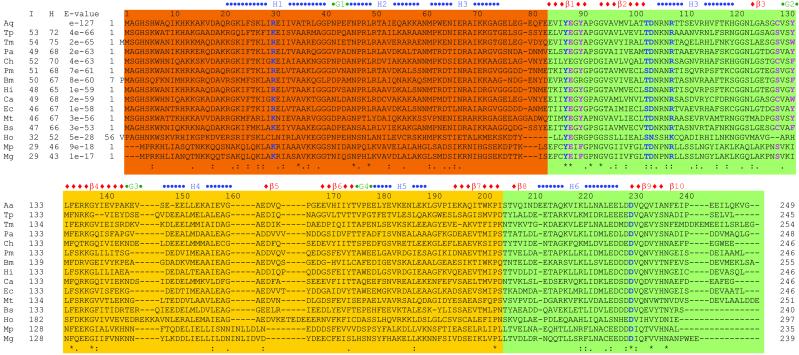
Figure 1.
Sequence comparison between Aq1575 and its homologs. Aq, A. aeolicus; Tp, Treponema pallidum; Tm, Thermotoga maritima; Pa, Pseudomonas aeruginosa; Ch, Clostridium histolyticum; Pm, Pasteurella multocida; Bm, Brucella melitensis; Hi, Haemophilus influenzae; Ca, Clostridium acetobutylicum; Ec, E. coli; Mt, Mycobacterium tuberculosis; Bs, Bacillus subtilis; Ho, Homo sapiens; Mp, Mycoplasma pneumoniae; Mg, Mycoplasma genitalium. “I” represents % identity, “H” represents % homology, and E values are from the result of PSI-blast. The domains are represented as follows: scarlet for domain 1; green for domain 2; and yellow for domain 3. Blue characters represent the residues at putative active site 1 (PAS1), and pink residues at PAS2 (see text). The “−”s represent gaps; “*” for conserved residues; “:” for homologous residues having hydrophobic side chain; and “.” for homologue residues having polar side chains.

