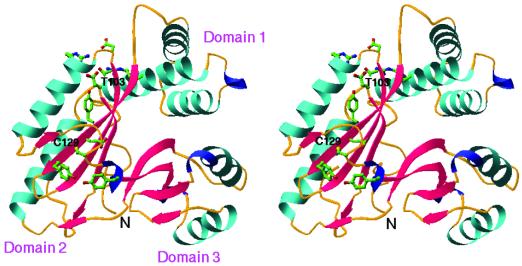
Figure 3.
A ribbon diagram of Aq1575. The figure was generated by using the program ribbons (39). α-helices are colored in cyan, β-strands are colored red, and 310-helix are colored blue. The highly conserved residues around putative active site are represented by a ball-and-stick model (blue for nitrogen atoms, red for oxygen, yellow for sulfur, and green for carbon). Each domain, N termini, Thr-103 (located at the center of the first putative active site, PAS1) and Cys-129 (the second putative active site, PAS2) are labeled.

