
Figure 7.
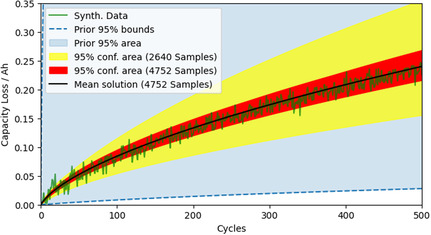
Results from performing inverse modeling of the synthetic data () with the correct “Cycling Model”. With an increasing number of drawn samples, the parameters’ joint probability distribution converges to the correct parameterization (black line) and a reasonable 95% confidence area (red) considering the noise level. The initial prior is wide (indicated by the blue 95% prior area) and significantly biased (nonsymmetric around the true values for the parameters).