
Figure 9.
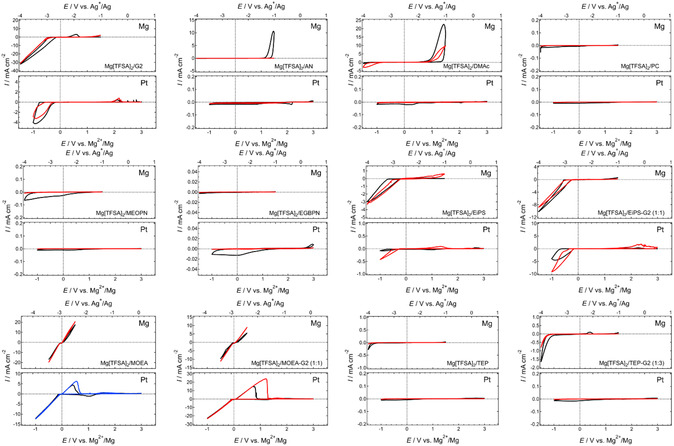
Cyclic voltammograms of (upper) Mg and (lower) Pt working electrodes recorded in a series of 0.5 mol dm−3 Mg[TFSA]2‐based electrolyte solutions at a scan rate of 10 mV s−1 at 30 °C. Black, blue and red curves represent the 1st, 5th, and 10th cycles, respectively. All voltammograms shown here are originally created for this review.