
Figure 9. The CFU-e/ETD switch is preceded by gradual shortening in G1 phase of the cycle.
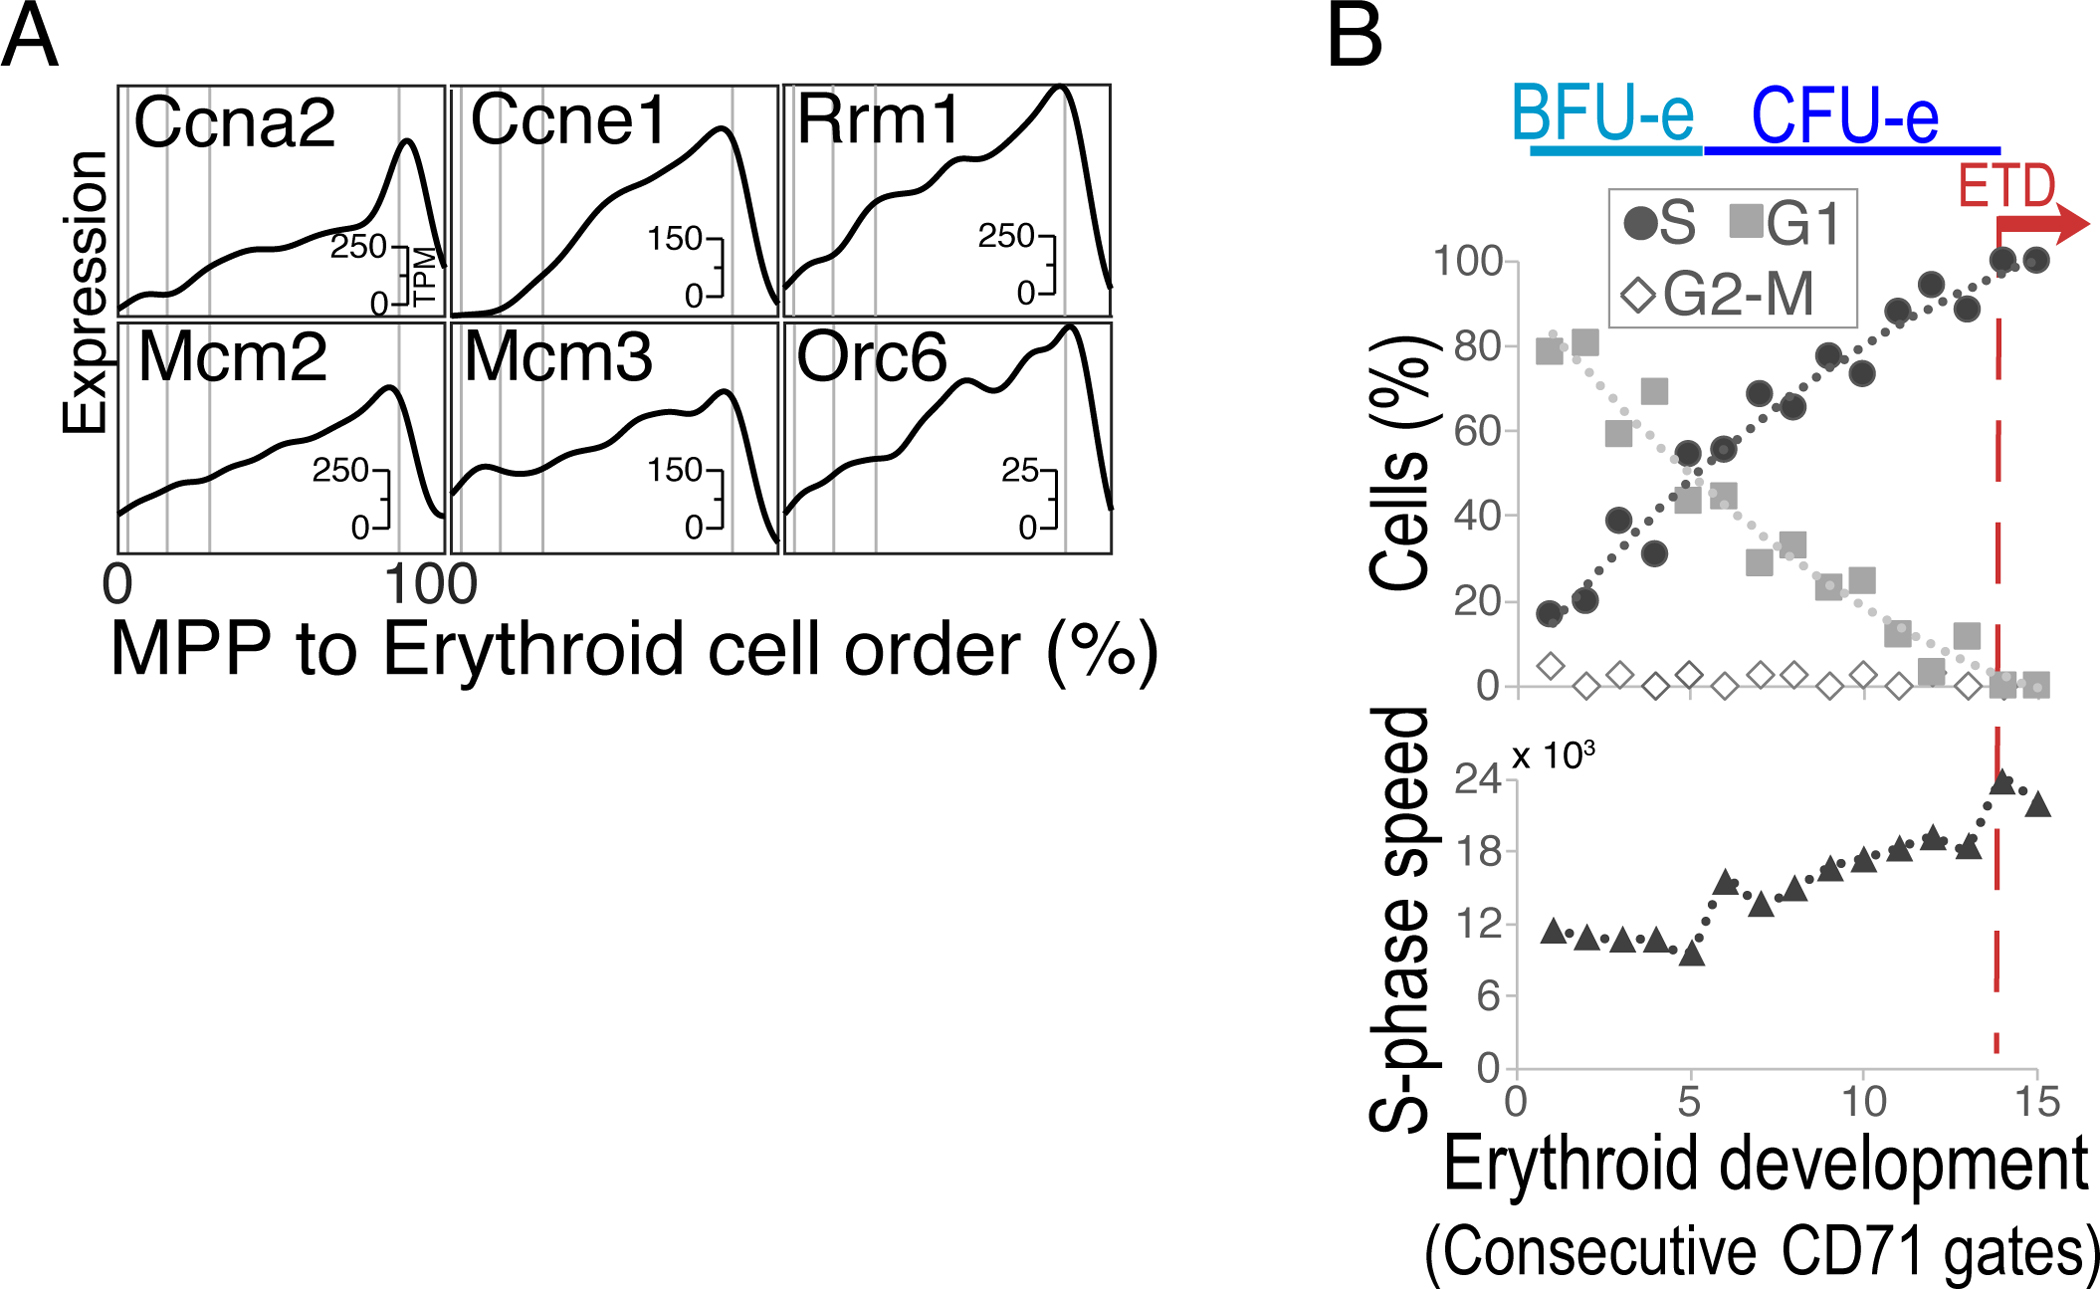
A Cell cycle genes are among the genes whose expression is most highly correlated with progression along the erythroid trajectory. Shown are examples of genes expressed in S phase, whose expression ramps up gradually, peaking at the CFU-e/ETD switch.
B Flow cytometric analysis of cell cycle phase and S phase speed along the erythroid trajectory shows a gradual increase in the fraction of cells in S phase, a complementary decrease of cells in G1, and a relatively constant S phase speed, as cells progress through the trajectory. These findings suggest gradual shortening of G1 phase preceding the CFU-e/ETD switch. The speed of S phase increases abruptly at the switch to ETD (dashed red line).