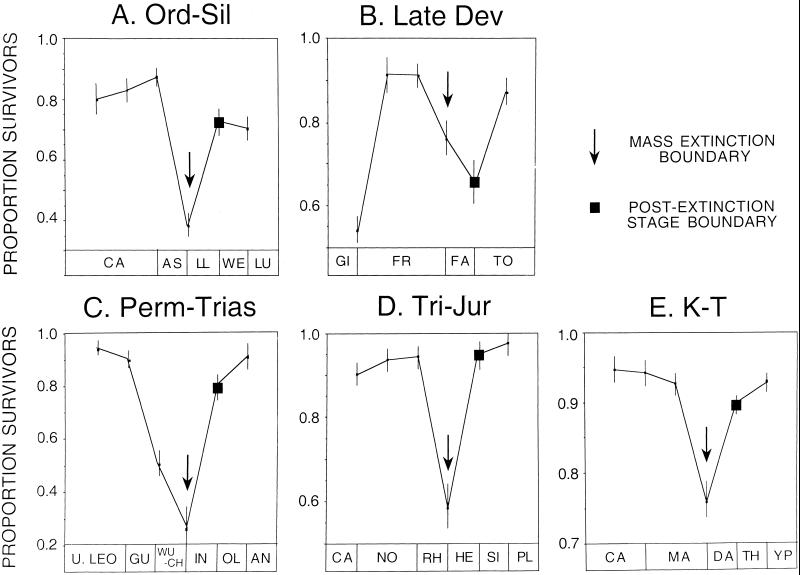
Figure 1.
Genus-level patterns associated with the Big Five mass extinctions, showing percent survivorship across a stage boundary only for those taxa that had crossed the preceding stage boundary. For four of the extinctions (A–C, E), a significantly greater proportion of genera that survived the extinction failed to persist beyond the immediately postextinction stage, relative to preextinction stages. Arrow, extinction boundary; square, survivorship proportion at the postextinction boundary; vertical bars = 95% CI, following Raup (63). Abbreviations at bottom of plots are first two letters of stratigraphic stage codes in ref. 13.

