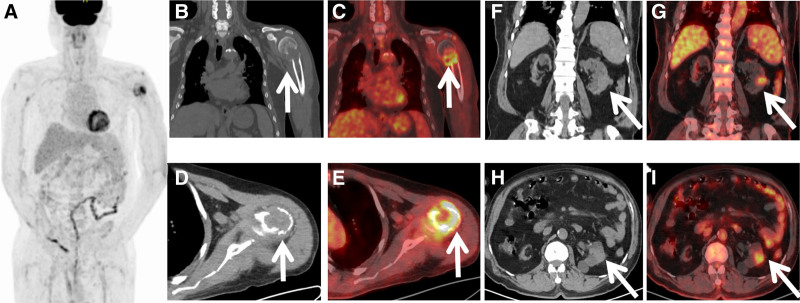
Figure 3.
The patient underwent an 18F-FDG PET/CT scan based on suspected malignant tumor. The MIP (A) images show a high 18F-FDG uptake in the left humerus. Coronal (B) and axial (D) CT images show bone destruction and soft tissue formation in the humerus, with fractures (arrows). The PET/CT fusion images (C, E) show high uptake of 18F-FDG (SUVmax, 8.6). Coronal (F) and axial (H) CT images show a soft tissue lesion in the lower part of the left kidney. PET/CT fusion images (G, I) show moderate uptake of 18F-FDG (SUVmax, 3.1). 18F-FDG PET/CT = 18F-fluorodeoxyglucose positron emission tomography/computed tomography, CT = computed tomography, MIP = maximum intensity projection.

