

ABSTRACT
This study aimed to investigate the skull morphometry and morphology of East Anatolian Red (EAR) and South Anatolian Red (SAR) cattle breeds using advanced 3D modelling techniques to establish comprehensive reference values. The study was based on 27 measurements and eight indices of the 42 skulls of male cattle collected from slaughterhouses in Türkiye. Craniometric measurements were analysed to identify potential morphological differences between the two breeds. Despite some observed differences in specific measurements, no statistically significant variations in skull morphometry between East Anatolian Red and South Anatolian Red cattle were found. SAR cattle exhibited a larger neurocranium than EAR. SAR cattle generally have a broader and more robust skull with a more pronounced nuchal crest and greater breadth of the foramen magnum. High variability within the EAR group suggested significant intra‐breed diversity, possibly due to genetic or environmental factors. The reference values established in this study serve as a crucial benchmark for monitoring morphological changes across generations and assessing the impact of selective breeding on skull structure. These findings contribute to the broader understanding of evolutionary developments and adaptations in cattle breeds, with significant implications for veterinary morphology, taxonomy, and breeding programs.
Keywords: craniometry, East Anatolian Red, morphology, skull index, South Anatolian Red
This study investigated the skull morphometry and morphology of East Anatolian Red (EAR) and South Anatolian Red (SAR) cattle using 3D modelling techniques, based on 27 measurements and eight indices from 42 male skulls collected from slaughterhouses in Türkiye. Although no statistically significant differences were found between the two breeds, SAR cattle exhibited a larger neurocranium, broader skull structure, more pronounced nuchal crest, and greater foramen magnum breadth. High variability within the EAR group suggested substantial intra‐breed diversity. The reference values established provide a valuable baseline for monitoring morphological changes and evaluating the effects of selective breeding in cattle populations.
1. Introduction
The measurement and documentation of cattle skulls have played a crucial role in discussions regarding the origin of cattle (Bartosiewicz 1980a). Researchers initiated the focus on skull type, especially in the context of studying the evolutionary origin and classification of animals (Felius et al. 2011, Ermiş et al. 2024). The Linnaean taxonomy system prioritises morphological distinctions of cattle species based on cranial shape and horn dimensions (Felius et al. 2011). As a result, identifying and categorising cattle skulls in archaeological contexts became feasible since craniology has long been employed for distinguishing and comparing Bos species at prehistoric sites (Grigson 1974).
The wild ancestor of modern cattle was the aurochs (Bos primigenius) (Guliński 2021). Aurochs roamed across Asia, Europe, and North Africa, but their domestication occurred in the Fertile Crescent region of the Middle East (Ulutas 1995). This domestication occurred between 10,300 and 10,800 years ago, precisely in Southeast Türkiye, near the border with Syria. The domesticated aurochs evolved into humpless domestic cattle (Bos taurus) (Guliński 2021).
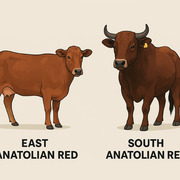
For their morphological characteristics, notable similarities, particularly in their head structures of the East Anatolian Red (Doğu Anadolu Kırmızısı‐DAK) and South Anatolian Red (Güney Anadolu Kırmızısı‐GAK) cattle breeds, have been extensively studied. These studies highlight that both exhibit various convergent traits due to their similar environmental adaptations and selective breeding practices (Yilmaz et al. 2018; Kocak et al. 2020). Both DAK and GAK breeds are very well adapted to the harsh climate, poor pastures, and severe conditions of the East Anatolian hills and uplands. GAK, in particular, is exceptionally well adapted to the region's hot and adverse conditions (Ertuğrul 1993; Gündemir et al. 2025). GAK is an essential genetic resource due to its disease resistance, particularly to blood parasites (Orman et al. 2000).
The skull, a critical bone structure in taxonomic studies, encloses the brain and houses sensory organs responsible for smell, hearing, balance, and the cranial parts of the respiratory and alimentary tracts (Ruzhanova‐Gospodinova et al. 2024; Gundemir and Szara 2025; Sokol et al. 2025). It is composed of two main parts: the cranium, mostly to encase and protect the brain, and the facial skeleton, which supports facial structures and includes bones that form the upper and lower jaws, nasal cavity, and eye orbits (Schaller and Constantinescu 2007; König and Liebich 2020; Çakar et al. 2024).
Bone metric and especially craniometric comparative studies have since been essential in revealing both similarities and differences both among and within species (Özkan et al. 2019; Gündemir et al. 2020; Mutlu et al. 2023; Güzel et al. 2023; Demircioğlu et al. 2024; Guzel and İşbilir 2024; Akçasız et al. 2024). Consequently, skull morphometry has remained a significant study area for examining individuals within the same species, healthy and abnormal animals in the same species, and comparing animals across different species (Rajathi 2015, Ermiş et al. 2024, Gündemir et al. 2023 and Özkan et al. 2024).
Extensive research has focused on collecting morphometric data on the skulls of different species to understand variations in skull morphology based on sex and species (Güzel et al. 2024, Korkmazcan et al. 2025). For instance, Özkan et al. (2019) conducted a comparative study on domestic cattle and buffalo skulls using linear measurements, highlighting the distinct morphometric features of each species. Similarly, Krasinska et al. (2008) examined European bison skulls, identifying sex‐based differences with linear measurements and pinpointing specific parts for distinguishing males and females (Szara et al. 2023). Additionally, Çakar et al. (2024) utilised linear measurements to reveal significant differences between breeds in their Simmental and Holstein skulls study.
Cankaya et al. (2005) and Oztabak et al. (2010) conducted studies to identify specific characteristics of South African Red cattle. Research on skull morphometry is crucial, as it offers valuable insights into these cattle breeds' evolutionary biology and functional anatomy. Detailed morphometric analyses can enhance breeding programs by identifying traits linked to health and environmental adaptation. Therefore, the study aimed to examine the skull morphometry and morphology of DAK and GAK cattle. Moreover, the reference values established by this study will aid in tracking morphological changes across generations and in assessing the effects of selective breeding on skull structure. By developing a comprehensive database of morphometric measurements, we can enhance our understanding of the evolutionary developments of these breeds and their adaptations to natural and artificial selection forces.
2. Materials and Method
2.1. Materials
This study utilised skulls from 12‐ to 14‐month‐old male East Anatolian Red cattle (Doğu Anadolu Kırmızısı‐DAK) (n = 19). South Anatolian Red cattle (Güney Anadolu Kırmızısı‐GAK) (n = 23) with All samples were male and were collected from Türkiye's Southeast Anatolia Region slaughterhouses, specifically Siirt and Diyarbakır, in June 2024. The maceration and cleaning process of the skull's samples, collected post‐slaughter, was carried out at Siirt University, Faculty of Veterinary Medicine, Department of Anatomy. For complete maceration, the skulls were submerged in a dermestid beetle colony for approximately one month, allowing the beetles to consume any remaining tissues while preserving the skulls' delicate structures. The cleaned skulls were then rinsed thoroughly and air‐dried for a week before measurements through scans were taken.
2.2. Modelling
The skulls were scanned for morphometric analysis using a Shining 3D EinScan Pro 2X (Shining 3D, Hangzhou, China). The high‐definition (HD) scanning mode was selected to obtain detailed and precise digital representations. The manual scanning mode allowed the operator to carefully navigate the scanner around the skulls, capturing all angles and features. The scanning speed was set to 20 frames per second, balancing detail capture and data‐processing demands. The dot distance, determining the scan resolution, was set to a maximum of 0.2 mm, ensuring even the most minor morphological features were accurately recorded. The scans were conducted in controlled environments to prevent interference from natural light, which could cause glare and impact scan quality. This ensured consistent lighting conditions, resulting in reliable and uniform scan results. After scanning, the raw data was processed using EXScan Pro (v4.0.0.4) software. This software is designed for mesh operations, creating a 3D mesh model from the scanned data points. The mesh models were then refined and optimised for further analysis, and the final models were saved in PLY (Polygon File Format), a standard for storing three‐dimensional data suitable for morphometric analysis.
2.3. Morphometric Analysis
A single researcher conducted all measurements to maintain consistency and accuracy. The 3D Slicer image computing platform (version 5.6.2) was utilized for linear measurements in a digital environment. This procedure involved using the 3D Slicer software to pinpoint anatomical landmarks on the 3D models. The researcher precisely placed points on these landmarks, and the software calculated the distances between them, yielding precise linear measurements. This digital method offers higher accuracy and repeatability compared to traditional manual techniques.
In the study, were conducted 27 distinct skull measurements inmillimetres (Figures 1, 2, 3, 4) using 3D modelling techniques on 42 cattle skulls using the methodologies outlined by von den Driesch (1976) and Özkan et al. (2019).
FIGURE 1.
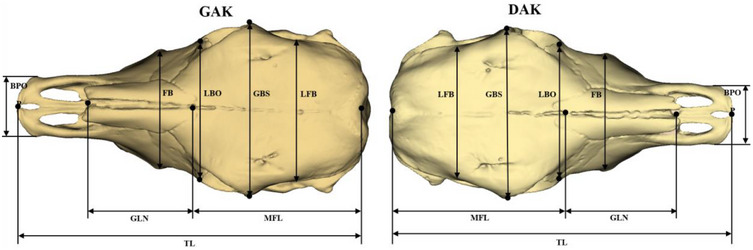
Dorsal view of the cattle skull. Total length (TL), protuberantia intercornualis‐prosthion; Median frontal length (MFL), protuberantia intercornualis‐Nasion; Greatest length of the nasals (GLN), Nasion‐Rhinion; Least frontal breadth (LFB), breadth of the narrowest part between two temporal lines; Greatest breadth of the skull (GBS), ectorbitale‐ectorbitale; Least breadth between the orbits (LBO), entorbitale‐entorbitale; Facial breadth (FB), across the facial tuberosities; breadth across the premaxillae on the rostral protuberances (BPOP).
FIGURE 2.

Lateral view of the cattle skull. Lateral length of the premaxilla (LLP), distance from nasoincisive notch‐prosthion; Greatest inner length of the orbit (GILO), ectorbitale‐entorbitale; Greatest inner height of the orbit (GIHO), vertical diameter of the orbit; Viscerocranium length (VCL), nasion‐prosthion; lateral facial length (LFL), ectorbitale‐prosthion.
FIGURE 3.

Ventral view of the cattle skull. Short skull length (SSL), Basion‐Premolare; Premolare‐Prosthion (PP); Dental length (DL), Postdentale‐Prosthion; Greatest palatal breadth (GPB), measured across the outer borders of the alveoli; Condylobasal length (CBL), caudal border of the occipital condyles‐prosthion; basal length (BL), basion‐prosthion.
FIGURE 4.

Caudal view of the cattle skull. Greatest mastoid breadth (GMB), Otion‐Otion; greatest breadth of the occipital condyles (GBOC), distance between the lateral borders of the occipital condyles; greatest breadth at the bases of the paracondylaris processes (GBPP), distance between the bases of the paracondylar processes; Greatest breadth of the foramen magnum (GBFM); Height of the foramen magnum (HFM), Basion‐Opisthion; Least occipital breadth (LOB), the distance between the most medial points of the caudal borders of the temporal grooves; Greatest height of the occipital region (GHOR), basion‐highest point of the intercornual protuberance; least height of the occipital region (LHOR), opisthion‐highest point of the intercornual protuberance.
The 27 measurements on the cattle skulls were:
Total length (TL): Protuberantia intercornualis‐prosthion
Median frontal length (MFL): Protuberantia intercornualis‐nasion
Greatest length of the nasals (GLN): Nasion‐Rhinion
Least frontal breadth (LFB): Breadth of the narrowest part between two temporal lines;
Greatest breadth of the skull (GBS): Ectorbitale‐Ectorbitale
Least breadth between the orbits (LBO): Entorbitale‐Entorbitale
Facial breadth (FB): Across the facial tuberosities
Breadth across the premaxillae on the rostral protuberances (BPOP)
Lateral length of the premaxilla (LLP): Distance from nasoincisive notch to prosthion
Greatest inner length of the orbit (GILO): Ectorbitale‐Entorbitale
Greatest inner height of the orbit (GIHO): Vertical diameter of the orbit
Viscerocranium length (VCL): Nasion‐Prosthion
Lateral facial length (LFL): Ectorbitale‐Prosthion.
Short skull length (SSL): Basion‐Premolare
Premolare‐Prosthion (PP)
Dental length (DL): Postdentale‐Prosthion
Greatest palatal breadth (GPB): Measured across the outer borders of the alveoli
Condylobasal length (CBL): Caudal border of the occipital condyles‐Prosthion
Basal length (BL): Basion‐Prosthion
Greatest mastoid breadth (GMB): Otion‐Otion
Greatest breadth of the occipital condyles (GBOC): Distance between the lateral borders of the occipital condyles
Greatest breadth at the bases of the paracondylar processes (GBPP): Distance between the bases of the paracondylar processes
Greatest breadth of the foramen magnum (GBFM)
Height of the foramen magnum (HFM): Basion‐Opisthion
Least occipital breadth (LOB): Distance between the most medial points of the caudal borders of the temporal grooves
Greatest height of the occipital region (GHOR): Basion‐highest point of the intercornual protuberance
Least height of the occipital region (LHOR): Opisthion—highest point of the intercornual protuberance.
Additionally, eight different indices were derived from the above measurements. These indices, which are ratios or proportions based on the measurements, provide further insights into the shape of the skulls and are listed below:
Skull index: GBS/TL × 100
Facial index: FB/VCL × 100
Frontal index: GBS/MFL × 100
Basal index: GBS/BL × 100
Length‐length index: MFL/VCL × 100
Palatal index: GPB/DL × 100
Orbital index: GIHO/GILO × 100
Foramen magnum index: HFM/GBFM × 100
2.4. Statistical Analysis
Measurements were recorded in millimetres to ensure precision and consistency, essential for detailed craniometric analysis. To assess statistical differences in linear measurements and index values between DAK and GAK cattle breeds, an analysis of variance (ANOVA) was conducted. ANOVA was chosen for its robustness in comparing means across groups and identifying statistically significant differences.
Before performing ANOVA, the homogeneity of variances was tested using Levene's test. This test is critical for verifying that the variances among the compared groups are equal, a fundamental assumption for ANOVA. The confirmation of homogeneity of variances with Levene's test ensured the validity and reliability of the ANOVA results.
Statistical significance was established at a p‐value of less than 0.05 (p < 0.05). This threshold indicates less than a 5% probability that the observed differences occurred by chance, signifying that the differences are statistically significant.
The normality of the data was assessed using the Shapiro–Wilk test, which evaluates whether the data follow a normal distribution, another critical assumption for ANOVA. Any significant deviations from normality were reported to maintain transparency and accuracy in the analysis.
Applying these statistical tests ensured the methodology was rigorous and the findings were based on sound statistical principles. This comprehensive approach enabled an accurate comparison of the craniometric measurements between the DAK and GAK cattle breeds, providing valuable insights into their morphological characteristics. For this purpose, the following views and measurements were used:
3. Results
3.1. Analysis of Variance
The linear measurement values of the GAK and DAK cattle skulls are presented in Table 1. From 27 measurements in total, the average and standard deviation of 21 of them were higher in GAK compared to DAK, and only six parameters, TT, PP, WCL, GLN, DL, and HFM, indicate that the skull length and viscerocranium length were higher in DAK compared to GAK cattle breeds.
TABLE 1.
The results of the linear measurements according to ANOVA.
| Nr. | Measurements (mm) | GAK | DAK | Levene's test | F | p value |
|---|---|---|---|---|---|---|
| 1 | TL | 458.73 ± 37.35 | 459.23 ± 49.62 | 0.453 | 0.0013 | 0.970 |
| 2 | CBL | 447.20 ± 27.95 | 446.91 ± 42.82 | 0.148 | 0.0006 | 0.979 |
| 3 | BL | 421.03 ± 33.15 | 420.36 ± 49.73 | 0.222 | 0.0026 | 0.959 |
| 4 | SSL | 292.76 ± 19.35 | 290.55 ±2 8.45 | 0.089 | 0.0886 | 0.768 |
| 5 | PP | 123.62 ± 11.78 | 124.74 ± 15.18 | 0.500 | 0.0732 | 0.788 |
| 6 | VCL | 243.4 ± 23.16 | 246.42 ± 27.49 | 0.805 | 0.1490 | 0.702 |
| 7 | LFL | 321.53 + 21.23 | 320.04 + 31.45 | 0.294 | 0.0334 | 0.856 |
| 8 | MFL | 217.6 ± 19.54 | 214.72 ± 23.52 | 0.480 | 0.1879 | 0.667 |
| 9 | GLN | 150.89 ± 20.31 | 160.04 ± 25.51 | 0.928 | 1.6764 | 0.209 |
| 10 | DL | 248.54 ± 15.87 | 250.39 ± 25.89 | 0.189 | 0.0805 | 0.778 |
| 11 | LLP | 139.85 ± 18.43 | 138.51 ± 13.90 | 0.203 | 0.0681 | 0.795 |
| 12 | GILO | 72.03 ± 5.78 | 69.53 ± 5.70 | 0.594 | 1.9658 | 0.169 |
| 13 | GIHO | 64.15 ± 5.95 | 64.04 ± 5.09 | 0.537 | 0.0042 | 0.948 |
| 14 | GMB | 200.21±19.00 | 191.62 ± 19.65 | 0.748 | 2.0603 | 0.159 |
| 15 | GBOC | 107.24 ± 10.41 | 105.51 ± 8.33 | 0.602 | 0.3418 | 0.562 |
| 16 | GBPP | 149.17 ± 14.46 | 146.14 ± 13.56 | 0.623 | 0.4825 | 0.491 |
| 17 | GBFM | 38.80 ± 4.14 | 37.73 ± 4.38 | 0.760 | 0.6486 | 0.425 |
| 18 | HFM | 37.88 ± 3.76 | 38.72 ± 2.29 | 0.089 | 0.7190 | 0.402 |
| 19 | LOB | 130.58 ± 21.64 | 125.64 ± 15.29 | 0.143 | 0.7003 | 0.408 |
| 20 | LFB | 161.60 ± 19.35 | 156.88 ± 15.44 | 0.374 | 0.7418 | 0.394 |
| 21 | GBS | 202.23 ± 18.37 | 200.93 ± 17.07 | 0.870 | 0.0554 | 0.815 |
| 22 | LBO | 159.69 ± 16.67 | 156.77 ± 16.42 | 0.832 | 0.3233 | 0.573 |
| 23 | FB | 147.03 ± 13.17 | 146.26 ± 16.70 | 0.419 | 0.0277 | 0.869 |
| 24 | BPOP | 78.14 ± 7.48 | 77.64 ± 10.16 | 0.654 | 0.0336 | 0.855 |
| 25 | GPB | 130.36 ± 10.00 | 129.77 ± 12.56 | 0.555 | 0.0288 | 0.866 |
| 26 | GHOR | 149.42 ± 14.48 | 147.08 ± 13.01 | 0.535 | 0.2970 | 0.589 |
| 27 | LHOR | 116.43 ± 11.45 | 112.94 ± 11.62 | 0.992 | 0.9563 | 0.334 |
Even though all measurements differed between the two cattle breeds, their differences were not statistically significant.
Most measurements exhibit high standard deviations, particularly in the DAK group, suggesting significant variability. The p‐values for all measurements are above the typical significance threshold (0.05), indicating no statistically significant differences between GAK and DAK breeds for any of the measured parameters. Levene's test results show that the variances between groups were generally similar, with no significant differences indicated by the p‐values well above 0.05. Overall, the results suggest no statistically significant differences in the morphometric measurements between the GAK and DAK groups.
Based on the data, GAK and DAK do not exhibit significant morphological differences in the measurements provided except for some elements like the intercornual protuberance, orbital length (GILO), and especially the occipital squama and the temporal fossa, which vary significantly between two cattle breeds. This could suggest that these two breeds have similar functional or structural characteristics, potentially due to similar selective pressures or breeding practices.
Despite having a longer skull, the neurocranium measurements of DAK, except GBFM, were lower, indicating that GAK has a larger neurocranium than DAK.
Measurements such as GMB, LOB, and LFB further supported this observation.
Even though the above parameters in the GAK cattle breed are slightly larger than DAK and the morphological differences between them are clearly visible, these parameters were statistically insignificant.
Based on the p‐values from the ANOVA results (Table 2), there were no significant differences between GAK and DAK cattle breeds for any of the calculated indexes, except the orbital index (p = 0.08586), which was lower than others but still above the typical threshold of 0.05. The skull, facial, and frontal indexes represent that the DAK cattle breed had an elongated skull and face, but the GAK breed had a more elongated neurocranium.
TABLE 2.
The results of the indexes according to ANOVA.
| Nr. | Indices | GAK | DAK | Levene's test | F | p value |
|---|---|---|---|---|---|---|
| 1 | Skull index | 44.15 ± 3.20 | 43.97 ± 3.29 | 0.92 | 0.0331 | 0.857 |
| 2 | Facial index | 60.66 ± 5.59 | 59.50 ± 4.68 | 0.43 | 0.5186 | 0.477 |
| 3 | Frontal index | 93.22 ± 7.62 | 94.04 ± 7.02 | 0.51 | 0.1306 | 0.720 |
| 4 | Basal index | 48.10 ± 3.48 | 48.10 ± 3.94 | 0.70 | 0.0001 | 0.995 |
| 5 | Length‐length index | 89.71 ± 7.50 | 87.23 ± 3.40 | 0.003 | 1.7681 | 0.191 |
| 6 | Palatal index | 52.48 ± 2.89 | 51.90 ± 2.17 | 0.40 | 0.5130 | 0.478 |
| 7 | Orbital index | 89.12 ± 5.34 | 92.33 ± 6.49 | 0.36 | 3.1016 | 0.086 |
| 8 | Foramen magnum index | 98.33 ± 11.78 | 104.00 ± 14.24 | 0.39 | 1.9917 | 0.1659 |
Related to the orbital and foramen magnum index, both breeds had almost circular orbits and foramen magnum.
This indicates that the indexes measured do not show significant variation between these two cattle breeds.
3.2. Morphological Differences
From a quick and external look, the skulls of the two cattle breeds, GAK and DAK, show that they are very similar to the skulls of other cattle breeds. However, if we look more carefully at each external surface supported by morphometric measurements, we can identify many differences between them.
In the dorsal surface, the skull differentiates significantly from the intercornual protuberantia, which is more elevated and narrower in DAK than in GAK, which is larger and lower. The frontal region and caudal orbits in the DAK breeds were narrower, which made the temporal fossa more visible from the dorsal view. The significant difference between these two breeds makes the length of the nasal bone in DAK longer.
The view of the skulls from the lateral surface confirms the development of intercornual protuberantia in the DAK cattle breed. The facial length was more pronounced in the GAK breed, supported by measurements of LFL and LLP. Because of the longer nasal bone in DAK, this breed's viscerocranium was also longer than GAK. The GAK cattle breed's nasal region was typically broader and more robust. The nasal openings were more prominent and more rounded. While in the DAK cattle breed, the nasal region was narrower and less robust, with smaller and more oval‐shaped nasal openings. The orbits in both breeds were prominent and almost circular, but in the GAK breed, the length of the orbits was more considerable.
From the basal view, the basal length, condylobasal length, and short skull length in the GAK breed were more extensive than in the DAK. However, interestingly, the dental and premaxillae lengths were more considerable in DAK than in GAK. These make it more visible that the oral cavity in the DAK breed was longer but narrower than the GAK, where it was shorter but broader. Also, the choanae region was more extensive in DAK than in the GAK breed.
The structures in the caudal surface were the most different between the two cattle breeds, GAK and DAK. The external occipital protuberance and nuchal crest in both breeds were entirely developed, which means the vast and robust attachments of the nuchal ligament and head and cervical muscles, which contribute to the connection of the skull with the vertebral column and the movements of the neck and the head. The intercornual protuberance was higher in DAK, but GAK's occipital squama was more expansive than in the DAK breed. The foramen magnum in both breeds was almost circular, but in the DAK breed, the foramen magnum was higher.
4. Discussion
Documenting craniometric measurements focused on the origins of cattle has been highly significant for ontogenetic studies (Bartosiewicz 1980; Özkan et al. 2019). However, there has been greater emphasis on craniological evaluations of domesticated bovid species (Bartosiewicz 1980; Grigson 1974, 1978). The primary objective of this study was to examine the skull morphometry of East and South Anatolian Red cattle. Although the results show differences in some measurements, they indicate no statistically significant variations between the breeds. This section discusses the implications of these findings in the context of previous research and the broader field of veterinary morphology. By establishing a clear morphological criterion, researchers can better identify the genetic and environmental factors contributing to skull shape and size (Çakar et al. 2024). The unconventionality of this study lies in its comprehensive use of advanced 3D modelling techniques to establish reference values. In contrast to traditional manual methods, 3D modelling offers enhanced accuracy and consistency (Çakar et al. 2024). By calculating linear measurements, the study offers a reliable, valuable dataset for a range of scientific and practical applications. This digital approach not only enhances the precision of the measurements but also saves time and allows for easier replication and verification of the results by other researchers.
The findings align with some aspects of previous research but diverge in others. In fact, in this study, we found no statistically significant differences between the East Anatolian Red (DAK) and South Anatolian Red (GAK) cattle breeds in any of the measured linear parameters or indices, aligning with previous findings that suggest similar morphometric traits among these breeds. While previous research, such as Bartosiewicz (1980), highlighted the potential importance of specific ratios (e.g., GBS, MFL, and VCL) in predicting skull variations, our results indicate that these ratios, along with skull, facial, basal, and frontal indices, do not contribute significantly to distinguishing between DAK and GAK. This is further evidenced by the high standard deviations observed in the DAK group, suggesting considerable variability within this breed yet no significant morphological differences compared to GAK.
Our study contrasts with findings from Özkan et al. (2019) and Krasinska et al. (2008), which reported notable morphological distinctions in other species. Özkan et al. 2019) identified significant morphometric differences between cattle and buffalo skulls, while Krasinska et al. (2008) found sex‐based differences in European bison skulls. However, our study aligns with Ünalan (2016), which recognised the genetic and environmental uniqueness of GAK and Native South Yellow (NSY) cattle, though without specifying significant morphological differences. Ünalan (2016) observed that GAK cattle had broader body sizes than NSY cattle. Similarly, our study finds that GAK cattle exhibit larger neurocranium dimensions and broader cranial measurements than DAK cattle, highlighting a consistent pattern of greater robustness in GAK cattle.
The similarities in skull measurements between DAK and GAK cattle suggest that both breeds may have undergone similar selective pressures or breeding practices, contributing to their comparable structural characteristics. Ünalan's research emphasises maintaining genetic diversity and sustainable breeding practices. Our findings, showing high variability within the DAK group, suggest that there is potential for further refinement through selective breeding. This intra‐breed variability is crucial for understanding the effects of genetic diversity and environmental factors on skull morphology (Ünalan 2016; Guliński 2021).
Additionally, Çakar et al. (2024) research comparing skull indices among Holstein and Simmental cattle provides a broader context for understanding morphometric variations in cattle breeds. Holsteins exhibited a lower skull index, indicating a relatively longer skull than Simmentals, which have a broader skull shape. The higher neurocranium measurements in GAK cattle align with findings from Çakar et al. (2024), which reported more extensive basal occipital area measurements in Simmental cattle than in Holsteins. This highlights the importance of considering breed‐specific adaptations and functional requirements in skull morphology.
The occipital region plays a crucial role in head movement, housing neck extension and flexion muscles. In larger ruminants like cattle, the structure of the occipital region supports efficient head movements necessary for feeding and other activities. Higher basal occipital area measurements (GBPP, LOB, GMB, and GBOC) in Simmental cattle compared to Holsteins indicate a larger occipital region in Simmentals, likely due to their broader lateral skull aspect, which provides a larger surface area for muscle attachment. Similarly, this study shows that these measurements are also higher in GAK cattle compared to DAK cattle. These findings underscore how breed‐specific adaptations can shape skull morphology and biomechanics.
Although the statistical analysis did not reveal significant differences between the DAK and GAK breeds, several morphological trends were observed that suggest subtle variations in skull morphology. GAK cattle generally exhibited larger neurocranium dimensions, as indicated by higher Least Occipital Breadth (LOB) and Least Frontal Breadth (LFB) measurements. These findings imply that GAK cattle may possess a broader neurocranium than DAK cattle. Additionally, while GAK cattle had a wider occipital region, their intercornual protuberantia was less pronounced than that of DAK cattle, which exhibited a more robust skull structure. The more significant variability within the DAK group suggests that there is potential for further refinement through selective breeding. At the same time, the overall lack of significant differences between the breeds indicates that selective pressures may not have drastically altered their cranial morphology.
Foramen magnum linear measurements have been widely utilised in animal studies, revealing significant morphometric insights. For example, Özkan et al. (2019) found that the height of the foramen magnum (HFM) was a distinguishing feature between cattle and water buffalo. Similarly, Akbas et al. (2023) identified HFM as a critical differentiator between sexes in cats, while Kupczyńska et al. (2017) classified foramen magnum shapes in different dog breeds into distinct structures, such as oval, pentagonal, rhomboid, and circular. In our study of East Anatolian Red (DAK) and South Anatolian Red (GAK), the foramen magnum measurements were very close and did not show significant differences. This suggests that while foramen magnum measurements did not serve as a distinguishing factor between these specific cattle breeds, they could prove to help differentiate other breeds in future research.
Reference values established in this study are invaluable for future research in veterinary morphology. These values provide a crucial criterion for monitoring morphological changes across generations and assessing the impact of selective breeding on skull structure. By developing a comprehensive database of morphometric measurements, researchers can enhance their understanding of the evolutionary developments of these breeds and their adaptations to both natural and artificial selection pressures. The broader implications of our findings extend to the fields of taxonomy and evolutionary biology. Establishing detailed morphometric data, such as that provided in this study, aids in the identification and classification of various animal species. Our findings contribute to the growing knowledge of cattle breeds' evolutionary trajectories and morphological adaptations.
Our findings align with some previous studies but diverge in their implications. For instance, while our results did not reveal significant differences like the findings of Ünalan (2016), they contrast with research such as Özkan et al. (2019) and Krasinska et al. (2008), which noted more pronounced morphological differences in other species. This underscores the complexity of cranial morphology and the influence of selective pressures and environmental factors.
5. Conclusions
This study aimed to explore the skull morphometry of DAK and GAK cattle, leveraging advanced 3D modelling techniques for enhanced accuracy. Several notable morphological trends emerged despite the lack of statistically significant differences between the two breeds in the measured linear parameters and indices. GAK cattle exhibited larger neurocranium dimensions, including broader measurements of the Least Occipital Breadth (LOB) and Least Frontal Breadth (LFB), suggesting a more robust cranial structure than DAK cattle. The broader occipital region in GAK cattle, alongside a less pronounced intercornual protuberance, contrasts with the much more pronounced one observed in DAK cattle. These observations indicate that while selective breeding practices may not have dramatically altered cranial morphology between the DAK and GAK breeds, subtle differences in skull structure remain. The variability within the DAK group, as evidenced by high standard deviations, highlights the potential for selective breeding to refine specific morphological traits further. These findings are essential for future research, breeding programs, and the broader field of veterinary morphology, as they offer insights into the evolutionary developments and adaptations of these significant genetic resources.
Author Contributions
Barış Can GÜZEL: Conceptualisation, investigation, supervision, writing – original draft, writing – review and editing. Burak Ünal: Writing –review and editing, visualisation, supervision and conceptualisation. Sokol Duro: Visualization and conceptualisation. Nikoleta Manuta: Writing – review and editing, visualisation, supervision and conceptualisation. Buket Çakar: Conceptualisation, investigation, supervision and writing – original draft
Conflicts of Interest
The authors declare no conflicts of interest.
Peer Review
The peer review history for this article is available at https://www.webofscience.com/api/gateway/wos/peer‐review/10.1002/vms3.70521.
Funding: This study was funded by the Scientific Research Projects Coordination Unit of Istanbul University‐Cerrahpasa (Project number: TSA‐2024‐37582). Türkiye Bilimsel ve Teknolojik Araştırma kurumu.
Data Availability Statement
The data that support the findings of this study can be requested from the corresponding author.
References
- Akbas, Z. S. , Duro S., Yalin E. E., Gündemir O., et al. 2023. “Detection of Sexual Dimorphism of the Foramen Magnum in Cats Using Computed Tomography.” Anatomia, Histologia, Embryologia 52: 595–602. [DOI] [PubMed] [Google Scholar]
- Akçasız, Z. N. , Akbaş Z. S., Özkan E., et al. 2024. “Geometric Morphometric Analysis of Scapula at Cats and Dogs.” Kafkas Univ Vet Fak Derg 30, no. 4: 481–487. [Google Scholar]
- Bartosiewicz, L. 1980. “Relationships Between the Cranial Measurements of Cattle.” OSSA 7: 3–17. [Google Scholar]
- Cankaya, S. , Kayaalp G. T., and Unalan A.. 2005. “Estimation of Correlation Among Sex, Birth Weight and some Body Measurements in South Anatolian Red Calves by Using Canonical Correlation Analysis.” Paper presented at the 3rd International Conference of the EMR‐IBS, Corfu, Greece, May 9–12, 2024: 21–27. [Google Scholar]
- Çakar, B. , Tandir F., Güzel B. C., et al. 2024. “Comparison of Skull Morphometric Characteristics of Simmental and Holstein Cattle Breeds.” Animals 14: 2085. [DOI] [PMC free article] [PubMed] [Google Scholar]
- Driesch, A. V. D. 1976. “A Guide to the Measurements of Animal Bones From Archaeological Sites.” Peabody Museum Bulletin 1: 1–136. [Google Scholar]
- Demircioğlu, İ. , Demiraslan Y., Güzel B., Koçyiğit A., and Demircioğlu A.. 2024. “Comparison of Cranium Shape in Hamdani and Awassi Sheep Using Dorsal and Lateral Landmarks.” Pakistan Journal of Zoology 56, no. 1:. [Google Scholar]
- Duro, S. , Gündemir O., Hadžiomerović N., Kotrošan D., and Szara T.. 2025. “Morphological and Morphometric Study of the Head Skeleton of the Balkan Chamois (Rupicapra rupicapra balcanica Bolkay, 1925) in the West Balkan Area.” Biologia 1–14. [Google Scholar]
- Ermiş, Ö. , Ünal B., Altundağ Y., et al. 2024. “Allometry and Atlas Shape Analysis Between Tekir and Mix‐breed Cats.” Kafkas Univ Vet Fak Derg 30, no. 1: 95–100. [Google Scholar]
- Ertugrul, O. 1993. “Some Yield Characteristics of South Anatolian Red (GAK) Cattle Raised in Ceylanpinar Agricultural Enterprise.” Lalahan Hay Arş Enst Derg 33: 1–12. [Google Scholar]
- Felius, M. , Koolmees P. A., Theunissen B., et al. 2011. “On the Breeds of Cattle—Historic and Current Classifications.” Diversity 3: 660–692. [Google Scholar]
- Grigson, C. 1974. “The Craniology and Relationships of Four Species of Bos 1: Basic Craniology: Bos Taurus L. and its Absolute Size.” Journal of Archaeological Science 1: 353–379. [Google Scholar]
- Grigson, C. 1978. “The Craniology and Relationships of Four Species of Bos: 4. The Relationship Between Bos primigenius Boj. and B. taurus L. and Its Implications for the Phylogeny of the Domestic Breeds.” Journal of Archaeological Science 5: 123–152. [Google Scholar]
- Guliński, P. 2021. “Cattle Breeds–contemporary Views on Their Origin and Criteria for Classification: A Review.” Acta Sci Pol Zootech 20: 3–18. [Google Scholar]
- Gündemir, O. , Özkan E., and Mutuş R.. 2020. “Morphometric Study on the Digital Bones in the Domestic Cattle.” Kafkas Üniv Vet Fak Derg 26, no. 1: 75–82. [Google Scholar]
- Gündemir, O. , Koungoulos L., Szara T., et al. 2023. “Cranial Morphology of Balkan and West Asian Livestock Guardian Dogs.” Journal of Anatomy 243, no. 6: 951–959. [DOI] [PMC free article] [PubMed] [Google Scholar]
- Gündemir, O. , and Szara T.. 2025. “Morphological Patterns of the European Bison (Bison bonasus) Skull.” Scientific Reports 15, no. 1: 1418. [DOI] [PMC free article] [PubMed] [Google Scholar]
- Gündemir, O. , Manuta N., Güzel B. C., et al. 2025. “Skull Morphology in Native and Non‐native Cattle Breeds in Türkiye.” Journal of Anatomy 247: 179–188. [DOI] [PMC free article] [PubMed] [Google Scholar]
- Güzel, B. C. , Demircioğlu İ., and İnce N. G. 2023. “Three‐dimensional Reconstruction and Morphometric Analysis of Mandible of Hamdani Sheep: A Computed Tomography (CT) Study.” Harran Üniversitesi Veteriner Fakültesi Dergisi 12, no. 1: 1–8. [Google Scholar]
- Güzel, B. C. , and İşbilir F.. 2024. “Morphometric Analysis of the Skulls of a Ram and Ewe Romanov Sheep (Ovis aries) With 3D Modelling.” Veterinary Medicine and Science 10, no. 2: e1396. [DOI] [PMC free article] [PubMed] [Google Scholar]
- Güzel, B. C. , Manuta N., Ünal B., et al. 2024. “Size and Shape of the Neurocranium of Laying Chicken Breeds.” Poultry Science 103, no. 9: 104008. [DOI] [PMC free article] [PubMed] [Google Scholar]
- Kocak, N. , Demir I., and Yilmaz E.. 2020. “Cranial Morphology and Adaptations of Eastern Anatolian Red and Southeastern Anatolian Red Cattle.” Livestock Science 240: 104243. [Google Scholar]
- Krasinska, M. , Szuma E., Kobrynczuk F., et al. 2008. “Morphometric Variation of the Skull During Postnatal Development in the Lowland European Bison Bison bonasus bonasus.” Mammal Res 53: 193–216. [Google Scholar]
- Kupczyńska, M. , Czubaj N., Barszcz K., et al. 2017. “Prevalence of Dorsal Notch and Variations in the Foramen Magnum Shape in Dogs of Different Breeds and Morphotypes.” Biologia 72: 230–237. [Google Scholar]
- Korkmazcan, A. , Ünal B., Bakıcı C., et al. 2025. “Exploring Skull Shape Variation and Allometry Across Different Chicken Breeds.” Ankara Univ Vet Fak Derg 72, no. 1: 1–7. [Google Scholar]
- König, H. E. , and Liebich H. G.. 2020. Veterinary Anatomy of Domestic Mammals: Textbook and Colour Atlas. 6th ed. Thieme Schattauer Verlag: 54–89. [Google Scholar]
- Mutlu, Z. , Karabağlı M., Altundağ Y., et al. 2023. “Radiogrametric Analysis of the Metapodial Bones in English Setters.” Kafkas Univ Vet Fak Derg 29, no. 2: 117–123. [Google Scholar]
- Orman, N. M. , Ertugrul O., and Cenan N.. 2000. “Characteristics of Lactation Curve in South Anatolian Red Cattle Breed.” Livestock Studies 40: 17–25. [Google Scholar]
- Özkan, E. , Siddiq A. B., Kahvecioğlu K. O., et al. 2019. “Morphometric Analysis of the Skulls of Domestic Cattle (Bos taurus L.) and Water Buffalo (Bubalus bubalis L.) in Turkey.” Turkish Journal of Veterinary and Animal Sciences 43: 532–539. [Google Scholar]
- Özkan, E. , Pazvant G., Aydın Kaya D., et al. 2024. “Computed Tomography‐based Evaluation of Skull Measurements and Eye Biometrics in Brachycephalic versus Non‐Brachycephalic Cats.” Pakistan Veterinary Journal 44, no. 3: 910–916. [Google Scholar]
- Oztabak, K. , Toker N. Y., Un C., et al. 2010. “Leptin Gene Polymorphism in Native Turkish Cattle Breeds.” Kafkas Üniv Vet Fak Derg 16: 921–924. [Google Scholar]
- Rajathi, S. 2015. “Morphometric Measurements of the Skull of the Cross Bred Cattle of Tirunelveli District With Reference to Anatomical Landmarks.” IJVASR 44: 116–119. [Google Scholar]
- Ruzhanova‐Gospodinova, I. S. , Vladova S., Szara T., et al. 2024. “Morpho‐Geometric Description of the Skulls and Mandibles of Brown Bears (Ursus arctos) From the Dancing Bear Belitsa Park.” Animals: an Open Access Journal from MDPI 14, no. 17: 2541. [DOI] [PMC free article] [PubMed] [Google Scholar]
- Schaller, O. , and Constantinescu G. M.. 2007. Illustrated Veterinary Anatomical Nomenclature. 3rd ed. Georg Thieme Verlag: 10–37. [Google Scholar]
- Szara, T. , Klich D., Wójcik A. M., and Olech W.. 2023. “Temporal Trends in Skull Morphology of the European Bison From the 1950s to the Present Day.” Diversity 15, no. 3: 377. [Google Scholar]
- Ulutas, Z. 1995. The Application of REML and BLUP to Estimate Breeding Value and Variance Components of Weights in East Anatolian Red Cattle and Brown Swiss Cattle. MSc. thesis, University of Wales. https://books.google.com.tr/books/about/The_Application_of_BLUP_and_REML_to_Esti.html?id=zl3MzwEACAAJ&redir_esc=y. [Google Scholar]
- Ünalan, A. 2016. “Comparison of Some Body Measurements of South Anatolian Red and Native South Yellow Cattle.” KSÜ Doğa Bilimleri Dergisi 19, no. 1: 112–116. [Google Scholar]
- Yilmaz, H. , Ekinci K., and Genc M.. 2018. “Morphological Characterization and Comparative Analysis of Eastern Anatolian Red and Southeastern Anatolian Red Cattle.” Animal Science Journal 89: 234–245. [Google Scholar]
Associated Data
This section collects any data citations, data availability statements, or supplementary materials included in this article.
Data Availability Statement
The data that support the findings of this study can be requested from the corresponding author.