
Figure 4.
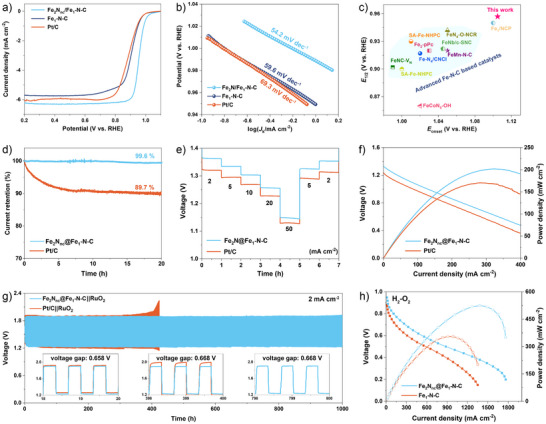
Electrocatalytic performance of Fe2Nnc/Fe1‐N‐C nanorods. a) LSV curves and b) corresponding Tafel plots of Fe2Nnc/Fe1‐N‐C, Fe1‐N‐C and Pt/C, c) comparison of ORR performance with advanced Fe‐N‐C based electrocatalysts in alkaline conditions. d) chronoamperometric stability test of Fe2Nnc/Fe1‐N‐C and Pt/C. e) Rate curves at different current density and f) curves of discharge polarization and the corresponding power density of Fe2Nnc/Fe1‐N‐C and Pt/C, g) charge‐discharge cycling curves of rechargeable ZABs using Fe2Nnc/Fe1‐N‐C + RuO2 and Pt/C + RuO2 mixtures as cathode catalysts. h) AEMFC performance obtained by using Fe2Nnc/Fe1‐N‐C and Fe1‐N‐C as cathode catalyst with a loading mass of 2 mg cm−2.