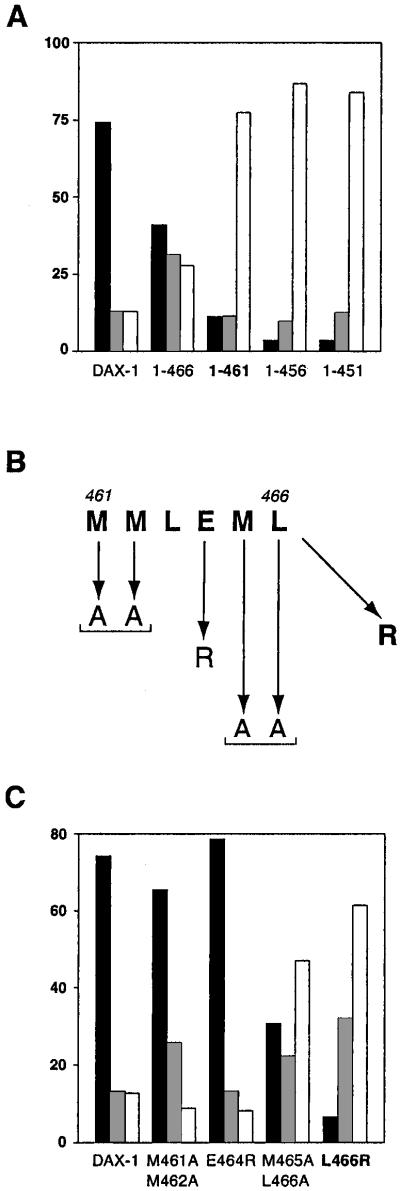
Figure 2.
Distribution of DAX-1 C-terminal mutants. (A) Subcellular localization of full-length DAX-1 and the 1–466, 1–461, 1–456, and 1–451 deletions in HeLa cells. (B) Sequence of the AF-2-like motif at the DAX-1 C terminus and mutations introduced. (C) Localization of the DAX-1 M461A/M462A, E464R, M465A/L466A, and L466R mutants. Percentage of nuclear localization is indicated with black histograms, nucleo-cytoplasmic localization in gray, and cytoplasmic localization in white. DAX-1 AHC mutants are indicated in bold.

