Figure 5.
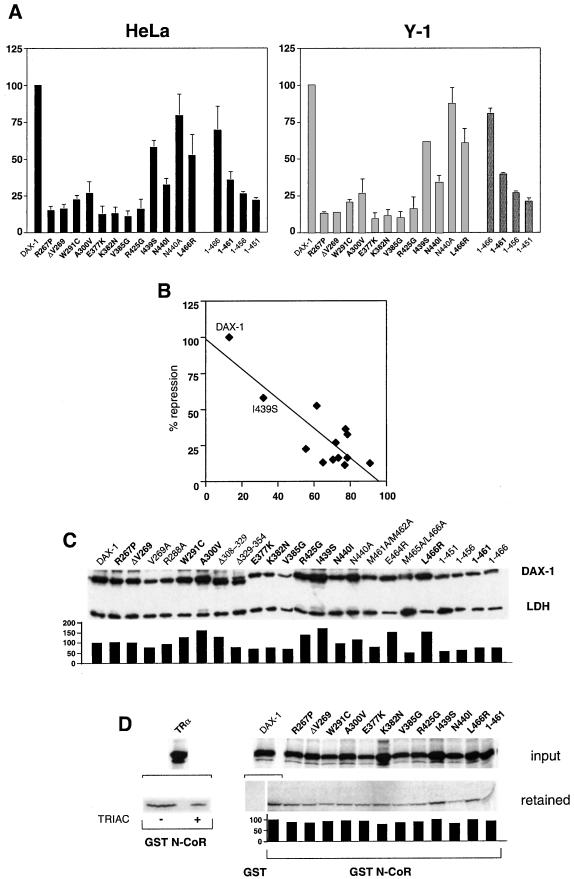
Loss of transcriptional repression by DAX-1 AHC mutants correlates with their cytoplasmic localization. (A) Histogram showing repression of StAR promoter activity by wild-type and mutant DAX-1 proteins in HeLa (Left) and Y-1 (Right) cells. StAR expression was activated by cotransfection of a SF-1 expression vector (HeLa) or forskolin (10 μg/ml) treatment (Y-1). Repression by DAX-1 mutants is expressed as percentage of the repression by wild-type DAX-1, which is set equal to 100. SEM is indicated. DAX-1 AHC mutants are indicated in bold. (B) Graph showing the relationship between repression activity (y axis) and percentage of cytoplasmic localization (x axis) of wild-type and AHC DAX-1 proteins. The position of the I439S mutant, whose repression activity is the least impaired, is indicated. r = 0.85. (C) Immunoblot showing expression of the various DAX-1 proteins examined. DAX-1 AHC mutants are indicated in bold. Expression levels were quantified by densitometry and normalized by the amount of endogenous lactate dehydrogenase (LDH) protein, with the expression of wild-type DAX-1 set equal to 100. (D) Pull-down assay showing interaction of DAX-1 proteins with GST (wild-type DAX-1) and GST N-CoR (1629–2453) (wild-type and mutant DAX-1 proteins). As a control, cTRα interaction with GST N-CoR (1629–2453) is shown in the absence (−) and the presence (+) of 10−6 M 3,3′,5-triiodothyroacetic acid (TRIAC). Fluorography exposure times were overnight for cTRα and 10 days for wild-type and mutant DAX-1 proteins. The ratio of bound to input protein is shown in the histogram, with wild-type DAX-1 set equal to 100.

