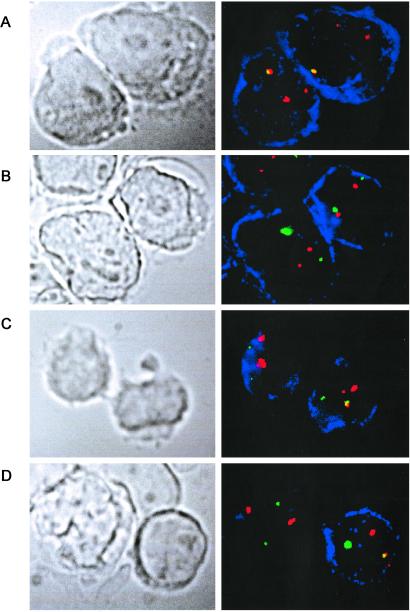
Figure 5.
Identification of TEL-AML1 fusion gene-positive cells in cord blood (B128) by immunophenotype/FISH analysis. In each case the fluorescent signal corresponding to the TEL probe is green, the AML1 probe is red, and the fused red-green signals corresponding to the TEL-AML1 fusion appear yellow. The cells positive for the corresponding immunophenotype are stained blue. (A) Positive control leukemic cell line REH, stained for CD10. Both CD10-positive cells show one fusion and two separate red signals. The smaller red signal corresponds to the translocated 5′ portion of the disrupted AML1 gene, and the larger red signal to the normal AML1 allele. Note that the green signal is absent because of deletion of the normal TEL allele in this cell line (as in most cases of ALL with TEL-AML1 fusion). (B) Negative control cell line Nalm 6, stained for CD10. Both CD10-positive cells show two green and two similar-size red signals, corresponding to two normal copies of TEL and AML1. (C) CD10-positive sorted cord blood (B128) cells. (Right) The cell shows one green, two different-sized red, and one (yellow) fusion signal, the expected signal configuration for a TEL-AML1-positive cell. The green (normal TEL) signal is present. (Left) The cell shows two green and two similar-sized red signals, corresponding to two normal copies of TEL and AML1. There is no fusion signal. (D) CD10−/CD34− cord blood cells stained for Ig κ. The κ-positive blue cell (Right) shows one yellow fusion, one green, and two different-sized red signals, the expected pattern for a TEL-AML1-positive cell. The normal TEL signal is present in this cell. The other cell (κ negative) shows two normal copies of TEL and AML1. (Magnifications: ×1,500.)

