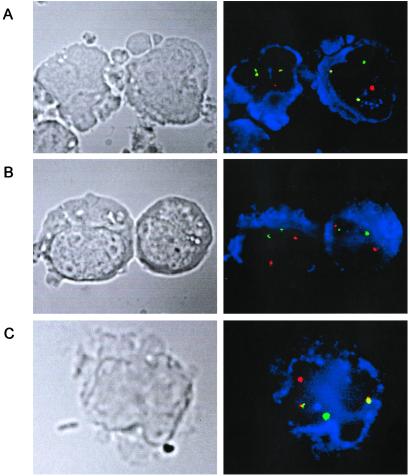
Figure 6.
Identification of AML1-ETO fusion gene-positive cells in cord blood (B169) by immunophenotype FISH analysis. In each case the fluorescent signal corresponding to the AML1 probe is red and the ETO probe is green. The cells positive for the respective immunophenotypes are stained blue. (A) Positive t(8;21) cell line Kasumi. Both CD13/CD33-positive cells show two red-green (yellow) fusion signals, corresponding to the AML1-ETO and ETO-AML1 gene fusions, in addition to the single green and red signals of the normal AML1 and ETO alleles. (B) t(8;21) negative control: Epstein–Barr virus-transformed normal blood lymphocytes stained for CD19. Both cells show two normal copies each of AML1 and ETO. (C) Cord blood sorted mononuclear cells stained for CD13/CD33. The CD13/CD33-positive cell shown has one red, one green, and two yellow fusion signals, consistent with the presence of the t(8;21). (Magnifications: ×1,500.)

