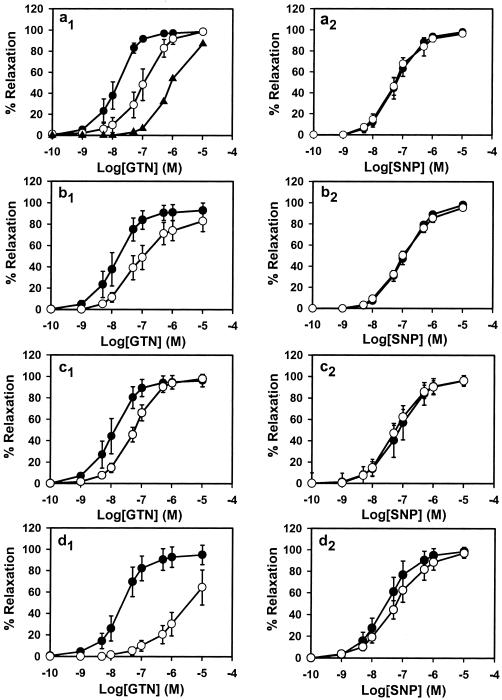
Figure 2.
Effects of inhibitor treatment and GTN tolerance on GTN-induced (Left) and SNP-induced (Right) relaxation in rabbit aorta. The dose–response curves of control rings are shown as ●, and inhibitor-treated rings (1 mM) are shown as ○. (a) Chloral hydrate dose–response (○, 1 mM; ▴, 5 mM). (b) Cyanamide. (c) Acetaldehyde. (d) GTN tolerant. All inhibitor curves (a–c) are significantly different from GTN control (P < 0.01), but none are different from SNP control (P = not significant). The GTN tolerance curve (d) is significantly different from control to P < 0.05. Data are expressed as the means ± SD of 4–6 aortic rings.

