

Abstract
A subset of imprinting control regions (ICRs) in the human and mouse possess CpG islands associated with imperfect tandem repeats (TRs) that were shown to be essential for genomic imprinting through genetic studies. To identify whether this feature is also present in non-imprinted CpG island promoters, we performed extensive dot plot analyses and identified 342 (326 autosomal and 16 X-chromosomal) human CpG island gene promoters associated with imperfect TRs of ≥ 400 bp, unit lengths 50–150 bp. Most occur as clusters at the human chromosome ends, distinct from the clusters of imprinted genes, and enriched in neurodevelopmental/behavioral disorders, with some showing interindividual variation in methylation levels. A subset of TR-CGIs is highly methylated and remains so during reprogramming to primed iPSCs, but become unmethylated in naïve iPSCs, as in the case of ICRs. Transcript levels correlate with methylation levels for some TR-CGI genes suggesting their gene regulatory potential. Non-TR CGI mouse orthologs of methylated human TR-CGIs are unmethylated in mouse, suggesting the association of TRs with higher methylation levels. Most human TR-CGIs accompanied primate evolution after divergence from mouse TR-CGIs with evidence of recent additions in hominid evolution. In summary, the incorporation of TRs in certain CGI promoters in mammalian evolution results in the unique ability to acquire methylation during human embryonic development and resist reprogramming to a pluripotent stem cell state with an effect on gene expression.
Supplementary Information
The online version contains supplementary material available at 10.1038/s41598-025-11213-5.
Keywords: DNA methylation, Epigenetic reprogramming, Stem cells, CpG Island, Human evolution, Genome organization, Genomic imprinting Repeat
Subject terms: Developmental biology, Evolution, Stem cells
Introduction
About 50% of mammalian gene regulation at the transcription initiation level takes place via CpG-rich promoter regions known as CpG islands (CGIs) that are mostly unmethylated in pre- and post-implantation embryonic development and post-natal life. The others acquire methylation during embryonic development and tend to be transcriptionally silent. A notable exception to the general rule is the parental origin-specific methylation of approximately 20 CG-rich autosomal imprinting control regions (ICRs), ~ 1–5 Kb in length. Methylation of these sequences is established during gametogenesis reflecting the parental sex by de novo methyltransferases and maintained post-fertilization by the DNA methyltransferase 1 (DNMT1)1. As a result, in eutherian mammals, one parental ICR allele is methylated and the counterpart unmethylated. Although there is uncertainty on the sequence requirements for establishing methylation, tandem repeat (TR) sequences have been experimentally shown to be essential for some ICRs3–7. The absence of sequence similarities between ICRs strongly suggests that repetitiveness majorly contributes to the imprinted state8.
De novo methylation of CpG dinucleotides is catalyzed by three DNA methyltransferase enzymes (DNMT3A, DNMT3B, and DNMT3C) and the related, but catalytically inactive DNMT3L. Together, these proteins catalyze major increases in genome-wide methylation during gametogenesis and post-implantation embryogenesis9. Once DNA methylation is established, DNMT1 maintains methylation on all DNA sequences following their replication. This process requires important co-factors such as NP95/UHRF and certain zinc-finger proteins such as ZFP57 and ZNF445 for perpetuation of ICR methylation with cell division9,10. A salient feature of DNMT1 is its distinct roles in maintaining methylation on ICR and non-ICR sequences. When DNMT1 protein is removed from mouse ES cells by blocking Dnmt1 transcription, both ICR and non-ICR sequences lose methylation. With re-expression of DNMT1 only non-ICR sequences recover their methylation11,12. Additionally, in vivo deletion of DNMT1o, the oocyte isoform of DNMT1, mirrors these in vitro findings – half of ICR methylation is permanently lost, but non-ICR methylation is normal post-implantation13. These findings suggest two DNMT1-dependent maintenance functions, one acting on ICRs and the other on non-ICR sequences. In support of this possibility, functional analysis identified Dnmt1 mutants that maintain only non-ICR methylation with loss of methylation in ICRs11,14.
Overexpression of DNMT1s, the somatic isoform, is lethal, whereas overexpression of DNMT1o in mice is not lethal. This suggests a non-catalytic function of the DNMT1s-specific amino-terminal domain, which when enhanced is lethal15,16. In summary, ICR methylation is a type of epigenetic memory, where, once established, is perpetuated with cell division and differentiation. In contrast, non-ICR methylation is part of a gene regulatory process, whose level changes in sync with changes in transcription rates17.
A second feature of monoallelic ICR methylation is its longevity; ICR methylation is established during gametogenesis and persists throughout preimplantation development despite genome-wide hypomethylation. Monoallelic methylation ensures transcription of genes in a dose-dependent manner that is required for normal development in mammals, yet generally not required after birth. For example, many imprinted genes are only expressed in the placenta but monoallelic ICR methylation persists for the lifetime of the individual18. From this, we reasoned that CGI methylation akin to ICR methylation may occur on non-imprinted sequences. For example, germline genes are targeted for repression in ES cells by the polycomb repressive complex 1.6 and DNA methylation19. Methylation of such sequences, initiated as de novo methylation at some developmental stage post-fertilization, and thereafter maintained by DNMT1, might differ from ICR methylation because post-zygotic de novo methylation can be cell type-specific and can differ between individuals.
Results
Identification of direct repeats in human promoter-proximal CpG Islands
To test these hypotheses mentioned under Introduction, we first generated analyzed dotplots of human promoter-proximal CGIs (see Materials and Methods) and identified 342 with tandem repeats (TRs) measuring ≥ 400 bp each, containing more than two copies of a perfect or imperfect repeating unit of ~ 50–150 bp (Supplementary Table S1). We refer to these sequences as TR-CGIs, of which 222 occur inside and 120 within 200 bp of a CGI. A vast majority of the TR-CGIs are autosomal (326) and were investigated in detail in the context of DNA methylation, epigenetic reprogramming, individual-to-individual variation, and its influence on the transcript levels (Fig. 1A). Dotplots of two TR-CGIs and one ICR are shown as examples in Fig. 1B. Additional dotplots with sequence alignments within TRs and relative positions of TRs and CGIs are shown in Supplementary Figure S1. As is the case for repeats in ICRs, DNA sequence of each TR is unique. Thus, if TRs were to provide similar properties to all TR-CGIs, it must be through their repetitiveness.
Fig. 1.

Identification and characterization of human CpG islands (CGIs) upstream or overlapping transcription start sites and containing tandem repeat sequences. (A) Schema for determining features of tandem repeat (TR)-containing CGIs at promoter regions. (B) Two examples of non-imprinted genes with TRs and their comparison with the KCNQ1OT1 imprinted region. Lines parallel to the central diagonal indicate the presence of tandem repeats; the number of lines is the number of repeats, and space between lines is the sequence length of a unit copy. (C) Chromosomal locations of the identified non-imprinted genes with TRs either in or within 200 bp of CGI promoters. Horizontal lines indicate individual genes whereas filled rectangles indicate gene clusters. (D-F) Top twenty most significant terms identified by DisGenet, Wikipathway and Biological process analyses. Vertical dashed red lines represent p value cutoff of 0.05. (G) Protein-protein interaction analysis of genes with TR-CGI promoters. (H) Proportions of genes associated with autism spectrum (ASD), bipolar (BPD), epilepsy (EPD) and schizophrenia (SZ). The horizontal dashed line indicates the expected value. The p values are given on the top of the histograms. (I) GTEx-analysis of genes with TR-CGIs in promoters. Vertical dashed lines represent p values of 0.05.
Approximately 60% of TR-CGIs are in 33 autosomal clusters, each with more than two genes, occurring in lengths ~ 2.5–23 Mb with ~ 0.5-6.0 TR-CGIs/Mb (Fig. 1C and Supplementary Table S1). Many autosomes contain more than one cluster, predominantly at the ends of chromosomes. CGI density follows that of euchromatin, which is much more broadly distributed than TR-CGIs. This is illustrated in a comparison of a CGI ideogram produced by mapping a library of CGI clones (most single-copy and near TSSs) to the human genome [20,21; see Fig. 4 in ref. 21]. TR-CGI distribution is clearly different from that reported for CGIs in general. An exception to this is chromosome 19, which has a high concentration of CGIs, 48 TR-CGIs (15% of total), and genes encoding ZNFs22. This extent of clustering to chromosome ends is not seen in mouse syntenic regions (Supplementary Table S1). Importantly, TR-CGI clusters do not overlap clusters of imprinted genes.
Biological pathways, diseases and physical associations with TR-CGI genes
Following this preliminary description, we compared wherever necessary, the features and phenomena associated with the 31 ICRs and the remaining 8,332 promoter-associated CGIs that are referred to as non-TR CGIs. Bioinformatic analyses of the autosomal TR-CGI genes by disease and gene ontologies yielded terms that are distinct from those identified for non-TR genes. (Fig. 1D and F, Supplementary Figure S2). Among the 25 diseases associated with the TR-CGI genes, 11 are neurological, neurodevelopmental, or behavioral disorders (Fig. 1D and E). The list of biological processes includes chromosome condensation, chromosome separation, nuclear envelope organization, and regulation of glutamate receptor (Fig. 1F). Protein-protein interaction analysis yielded a single cluster of proteins involved in ubiquitinylation, and nuclear receptor corepressor activities (Fig. 1G). Within neurological/behavioral disorders, there was a significant overrepresentation for epilepsy, but underrepresentation in case of schizophrenia (Fig. 1H and Supplementary Table S2). GTEx analysis confirmed significant association of TR-CGI gene expression in the amygdala with no sex bias (Fig. 1I and Supplementary Table S2).
Sequence, DNA methylation, and chromatin features of TR-CGIs compared to ICRs and non-TR CGIs
To determine similarities and differences between TR-CGIs, non-TR CGIs and ICRs, we compared their DNA sequence composition, DNA methylation, and chromatin features. Only the CGI regions of the TR-CGIs, non-TR CGIs and ICRs were used for sequence composition and DNA methylation analyses. GC-content and CpG ratio analysis showed major overlaps between TR-CGIs, ICRs and non-TR CGIs. Non-TR CGIs were broadly distributed, whereas TR-CGIs and ICRs narrowly distributed and within non-TR CGIs distribution (Fig. 2A and Supplementary Table S3).
Fig. 2.

Sequence features, methylation levels and chromatin modifications associated with the TR-CGIs. (A) GC content and CpG ratio analyses of imprinting control regions (ICRs), TR-CGIs and non-TR & non-ICR CGIs (Non-TR). (B) Proportions of TR-CGIs (blue), non-TR CGIs (red), and ICRs (green) methylated in seven human tissues (muscle, adipose, skin, liver, thyroid, cerebral cortex NeuN+, cerebral cortex NeuN-), three samples each. (C) PCA of TR-CGIs in seven different tissue types. (D) Heat map of TR-CGI methylation of 59 loci in 62 independent primary fibroblast cell lines. (E) Example of tissue-specific DNA methylation in a TR-CGI (LIG4). (F) UCSC browser screenshot showing the methylation levels of the RGPD1 5’-most TR-CGI in six different tissues from different individuals. Sample identities are given above each track with black vertical lines. The height of each vertical line represents the methylation value (0.0 corresponds to 0% methylation, whereas 1.0 represents 100%) of the CpG site. (G) Analysis of ZFP57 binding sites in ICR, Non-TR and TR-CGIs. (H) Proportion of methylated TR-CGIs (blue), ICRs (green) and sample of 37 non-TR CGIs (red) occupied by H3K9Me3, H3K36Me3 and SETDB1. The results were obtained after analysis of publicly available datasets: GSE109559, GSE53261, GSE233417, GSE247551, GSE200839, GSE200834, GSE175320, GSE175195, GSE129548.
Proportions of TR-CGIs (blue), non-TR CGIs (red), and ICRs (green) with methylation levels ≥ 30% in seven human tissues (muscle, adipose, skin, liver, thyroid, cerebral cortex NeuN+, cerebral cortex NeuN-) were taken as methylated for further comparisons (Fig. 2B, Supplementary Table S4, and Supplementary Fig. S3). For all seven tissues, the proportion of methylated TR-CGIs is significantly greater than the proportion of methylated non-TR CGIs (p = 1.46E-14), and most tissues contained nearly all ICRs as methylated. PCA of methylated TR-CGIs showed clustering of five tissues (muscle, adipose, skin, liver, thyroid) (Fig. 2C). Divergent distributions for NeuN + and NeuN- cerebral cortex cells reflect different levels of methylation for TR-CGIs in the cortex, as well between NeuN + and NeuN- cells.
We examined the levels in methylation of 59 TR-CGIs in fibroblast lines derived from 62 individuals (Fig. 2D)23. For most TR-CGIs, a majority of the individuals had methylation values within a narrow range. However, the remaining showed a broader range, e.g., PIWIL1. Among these two groups, one or more individuals showed markedly different methylation values from most of the others, e.g., GNG8.
To investigate whether the TR-CGIs methylated in one tissue show similar levels of methylation in other tissues and to compare their levels of methylation in the CGI regions with TR regions, whole genome bisulfite sequencing (WGBS) data was obtained for different tissues from the publicly available databases. A few TR-CGIs such as the LIG4 were methylated to significantly different levels in different tissues (Fig. 2E). A set of 14 TR-CGIs that contain TRs at different locations relative to the CGIs were analyzed further. We observed no drastic difference in the levels of methylation between the CGIs and the associated TRs (Fig. 2F and Supplementary Fig. S4). In addition, among the 14 TR-CGIs studied, there was no significant difference in the levels of methylation in the six tissues used for analysis.
Previously published data suggested that ICR regions have a significant preferential binding to proteins such as ZFP57, ZNF445 and SETDB19,10. Nearly one-fourth of the ICRs contain ZFP57 binding sites whereas the corresponding values were roughly 6.5% for non-TR CGIs and 7.0% for the TR-CGIs (Fig. 2G). These data indicate significant enrichment of the ZFP57 binding sites in ICRs. When enrichment for H3K9me3 and H3K36me3 modifications and binding sites of SETDB1 were investigated in 30 each of the TR-CGIs and non-TR CGIs and the 25 ICRs, a significant enrichment was observed in case of ICRs but there was little difference between the remaining two categories of sequences (Fig. 2H). Examples of TR-CGIs with their DNA methylation, histone modifications, and SETDB1 binding tracks are shown in Supplementary Fig S5. Data on ZNF445 could not be obtained because of lack of consensus sequences.
Effects of reprogramming of differentiated tissues to iPSCs on methylation levels of TR-CGIs
An important characteristic of all ICRs is their exemption from epigenetic, i.e. methylation, reprogramming in vitro in iPSC generation and in vivo in preimplantation. To determine if TR-CGIs also share this feature, we analyzed methylation data on six different embryonic tissues (brain, muscle, skin, lung, kidney and pancreas) and two isogenic primed iPSC lines (iPSC1 and iPSC2 for each tissue) derived from each tissue24. Between different embryos, there was no difference in the levels of methylation among the six tissues for ICRs, but there was a significantly lower variation for TR-CGIs than non-TR CGIs among the same tissues (p = 0.0069) (Fig. 3A and Supplementary Table S5). This difference between TR- and non-TR CGIs could be because of tissue-specific differences in methylation in the latter category. Although there was a higher degree of variation between different iPSCs, the difference was significant in the case of TR-CGIs and ICRs, but not the non-TR-CGIs. The effects of reprogramming accompanying the iPSC generation are evident in TR-CGI, non-TR CGIs and ICRs as average percents of CGIs undergoing significant methylation changes. TR CGIs and ICRs show similar levels of resistance to change, and both are more resistant than non-TR CGIs (Fig. 3A). PCA analysis of the three categories of sequences revealed the effects of reprogramming on the methylation levels and that the two iPSC lines derived from the corresponding tissues (iPSC1 and iPSC2) showed a higher degree of variation than the tissues (Fig. 3B–D).
Fig. 3.

Reprogramming of TR-CGIs, non-TR CGIs and ICRs (A) Changes in methylation of TR-CGIs (blue), non-TR CGIs (red), and ICRs (green) during reprogramming of tissue to primed iPSCs. Dots are different tissues from which iPSCs were derived. (B–D) Principal Components Analysis (PCA) of ICRs, nonTR-CGIs and TR CGIs based on their methylation levels in the multiple tissues and their iPSCs. The dots represent different samples. (E) Percentages of the three sequence classes (TR-CGIs, non-TR CGIs and ICRs) undergoing methylation changes (≥20%) in transition from BJ fibroblasts to either naïve or primed iPSCs. The results were obtained after analysis of publicly available datasets: GSE200834, GSE76970, GSE110366, GSE76641.
A second important feature of ICRs during in vitro reprogramming is their maintenance of somatic methylation in primed, but not naïve iPSCs25,26. When data on BJ fibroblasts and primed as well as naïve iPSCs derived from them25 were analyzed, TR-CGIs and ICRs showed significantly lower methylation in naïve iPSCs, whereas non-TR CGIs showed no difference between primed and naïve iPSCs (Fig. 3E and Supplementary Fig. S7). Thus, TR-CGIs are similar to ICRs by their: (1) lower-level variation among the different tissues of the same individual (embryo); (2) resistance to reprogramming in primed iPSCs; and (3) marked demethylation in naïve iPSCs.
Spermatogenesis specifically affects the methylation levels of ICRs and TR-CGIs
An additional approach to assessing the stability of methylation among the three classes of sequences is to compare the data on gametes and somatic tissues from the same individual. This is because gametogenesis is one form of in vivo reprogramming wherein demethylation in the primordial germ cell genome is followed by the establishment of gamete-specific methylation patterns. To enable these analyses, methylation data on five males from somatic cells (blood and saliva) and semen were used (Fig. 4A-E and Supplementary Table S5)27. Average methylation values of blood and saliva from each person were used as reference for identifying sequences with ≥20% difference in the methylation levels in both the somatic tissues and semen of the same individual. The data suggest that non-TR CGIs show significantly higher variation in somatic tissues than TR-CGIs or ICRs. There was no difference in the proportion of sequences in this category showing variation in methylation levels between semen and other tissues however, significant differences between the two categories of cell types were observed in case of TR-CGIs and ICRs (Fig. 4A-B). The closer relatedness between the somatic tissues over their distant similarity to semen was also obvious in the PCA analysis of the three categories of sequences (Fig. 4C-E).
Fig. 4.
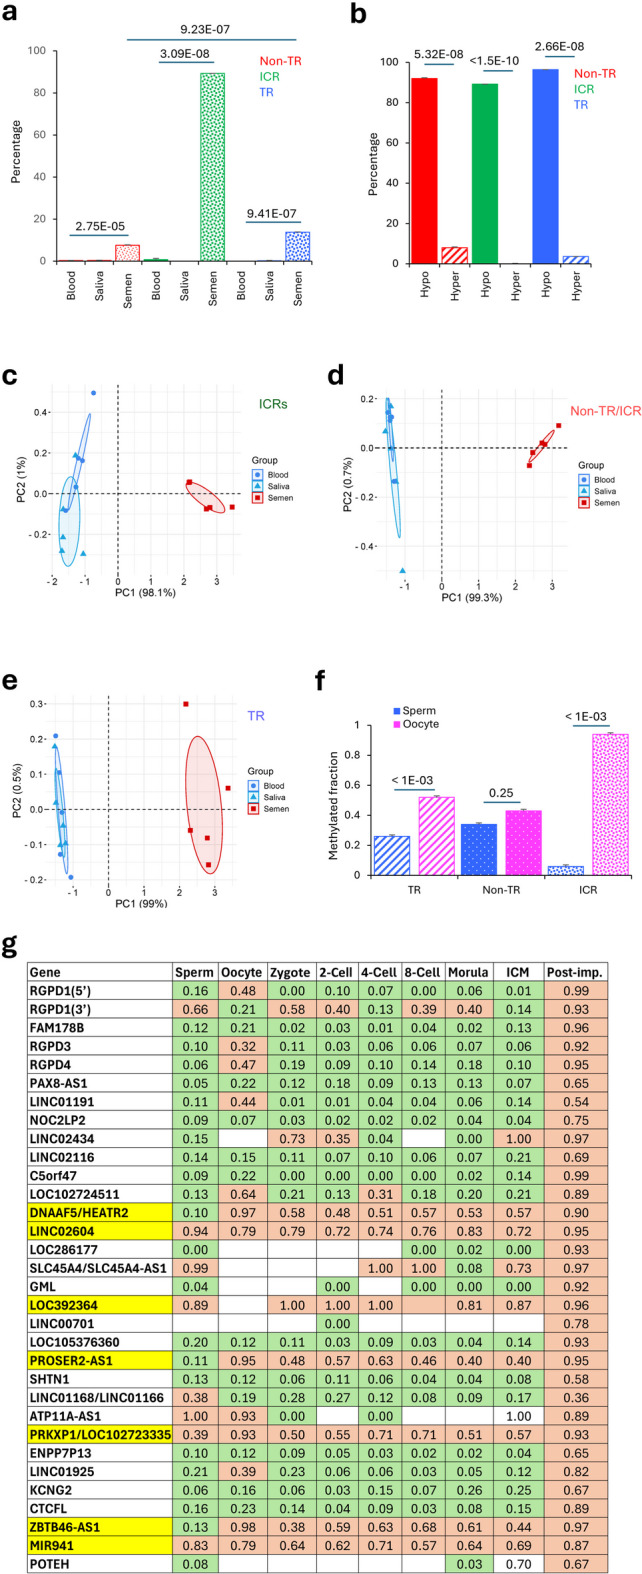
Effects of spermatogenesis-associated reprogramming on the methylation levels of TR-CGIs. (A) Proportion of non-TR CGIs (red), ICRs (green), and TR-CGIs (blue) with differences in methylation between blood/saliva and semen. Values were determined by comparing the same samples from five different individuals. Average methylation levels in the blood and saliva (body fluids) are used as reference. (B) Most changes between blood/saliva and sperm for non-TR CGIs (red), ICRs (green) and TR-CGIs (blue) involve hypomethylation. (C–E) PCA analyses of the three different categories of CGIs based on their methylation levels in blood, saliva and semen. (F) Methylated fractions of TR-CGIs, non-TR CGIs and ICRs in sperm and MII oocytes. (G) TR-CGI methylation from gametes through preimplantation cleavage stages and post-implantation embryos. Values are methylated fractions of CGI CpGs. Seven TR-CGIs highlighted in yellow are methylated in all preimplantation stages. 32 TR-CGIs were examined. Green rectangles – low methylation. Salmon rectangles – high methylation. Data are taken from publicly available datasets: GSE49828, GSE51239.
A comparison of methylation levels of TR-CGIs and non-TR CGIs between oocytes and sperm would shed light on the fraction of shared and unique sets of sequences. For this purpose, methylation data on sperm and oocyte were used to determine the proportion of sequences that show ≥ 30% methylation in oocytes only, sperm only or both (Fig. 4F). The fraction of sequences showing differences in methylation levels in the gametes was, as expected, highest in case of ICRs, significantly different in TR-CGI (p < 0.001) and not different in non-TR CGIs (p = 0.25) (Fig. 4F and Supplementary Fig. S9). Overall, ~ 60% and ~ 20% of the TR-CGIs with ≥ 30% methylation showed sperm- and oocyte-specific methylation, respectively, whereas the remainder were methylated in both types of gametes Similar results were obtained with non-TR CGIs. Examples of the TR-CGIs with increased methylation in oocyte relative to sperm and vice versa are shown in Supplementary Fig. S8.
TR-CGI methylation in preimplantation
Preimplantation development, i.e., the progression of the zygote to the blastocyst is another phase of reprogramming that naturally occurs in eutherian mammals, a phase in which there is genome-wide loss of methylation by active as well as passive processes. However, ICRs are resistant to this reprogramming process and the methylated states established in the gametes are maintained in preimplantation28,29. TR-CGI genes are not among lists of known imprinted genes, so we do not expect a priori that TR-CGI methylation is inherited from gametes. Specifically, we expect TR-CGIs to be unmethylated in gametes, or if methylated in one or both gametes, unmethylated in one or more preimplantation stages. To test this notion, we examined the methylation levels of 32 TR-CGIs in gametes and preimplantation cleavage stages (Fig. 4G and Supplementary Fig. S10). All 32 of these TR-CGIs were methylated in post-implantation embryos. There are three temporal patterns of TR-CGI methylation: (1) methylated in MII oocytes +/- sperm and methylation maintained in preimplantation, e.g., PROSER2-AS1 and PRKXP1; (2) methylated in MII oocytes +/- sperm and methylation absent in preimplantation, e.g., RGPD4 and LINC01925; and (3) unmethylated in both gametes and preimplantation, e.g., FAM178B and LINC02116. The first temporal pattern of TR-CGI methylation may represent inheritance of methylation, akin to inheritance of methylation on an imprinted allele. More importantly, TR-CGIs unmethylated in toti- and pluripotent stages of preimplantation (second and third groups) should be unmethylated in iPSCs, if iPSCs are indeed true epigenetic representations of toti- and/or pluripotency. Because they are instead methylated in primed iPSCs, this raises the possibility that reprogramming of somatic cells to primed iPSCs may be incomplete. Whether this TR-CGI methylation interferes with the developmental potential of iPSCs is not known.
A subset of TR-CGI associated gene transcription correlates with the level of TR-CGI methylation
A small number of TR-CGIs showed inter-individual differences in the levels of methylation in fibroblasts that allowed testing of the relationship between their methylation and transcript levels (Fig. 2D). Analysis of 62 human fibroblast lines23 identified five TR-CGI genes with significant inter-individual differences in the methylation levels with both positive and negative correlations between their methylation and transcript levels (Fig. 5A and Supplementary Fig. S14). We also took advantage of the observation that TR-CGIs showed differences in methylation levels between naïve and primed iPSCs. Here, we used UCLA1, a primed human embryonic stem cell line and its naïve derivative obtained after 5iLAF treatment26. Both transcript and methylation data were available for 23 genes wherein associated TR-CGIs showed ≥ 20% methylation difference between the two cell types (Supplementary Table S6). Of these, five genes showed significant correlation between the methylation and transcript levels (Fig. 5B and Supplementary Table S6). In the case of BRSK2, there was a positive correlation, whereas in the case of RGPD1, NOC2L, RGPD3, and RGPD4, there was a negative correlation. A loss of TR-CGI methylation may directly cause the transcription increase, or alternatively, the increase may be due to genome-wide methylation loss.
Fig. 5.
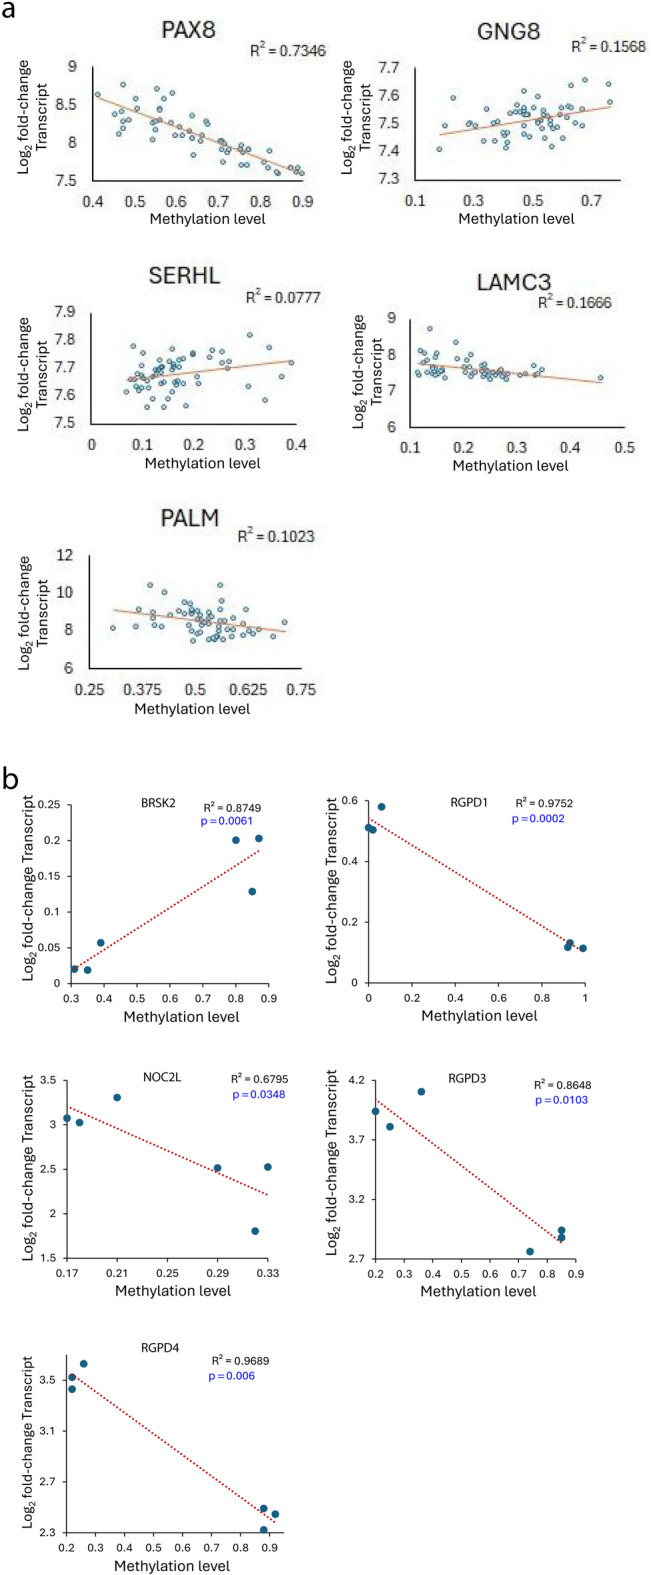
Relationship between the levels of methylation of TR-CGI promoters and their transcripts. Correlation plots showing methylation levels on the X-axis and expression levels on the Y-axis for (A) five TR-CGI genes in fibroblasts from 62 individuals and (B) five TR-CGI genes in isogenic primed and naïve iPSCs. Data was taken from three samples each of naïve and primed hESCs. The results were obtained after analysis of publicly available datasets: GSE76970.
Acquisition of tandem repeats accompanied human evolution with evidence of recent additions
We compared orthologous sequences among primates and mouse to gain insights into the origins of the identified human TR-CGIs. Only 17 of the 304 human TR-CGIs also had TRs in the orthologous mouse CGIs (Supplementary Table S1). Whereas some of the remaining TR-CGIs (e.g., TOAK3) acquired tandem repeats at the evolutionary divergence of mouse and primates, many (e.g., AXIN1) were present after the divergence of lower primates or strepsirhines (e.g., lemurs) and higher primates or platyrhines (e.g., New and Old World monkeys) (Fig. 6A and Supplementary Table S1). Although, lesser in number, there was evidence of gain of the TRs at the divergence of New World and Old World monkeys (e.g., GEMIN4) as well as at hominid and non-hominid divergence ~ 29.6 million years ago (e.g., PRKXP1)30.
Fig. 6.

Evolutionary origins of TRs in TR-CGI genes. (A) For each orthologous gene, dot plots of the CGI-promoters and surrounding sequences from the five species are displayed. Blue rectangles are TR-CGIs and black rectangles are CGIs without TRs. Arrows are transcriptional start sites and directions of transcription. (B) Comparisons of methylation profiles of orthologous genes in human, Rhesus macaque and mouse. *** indicates p values < 0.0001 estimated by Fisher’s paired t-test. *TR present in human, but not in Rhesus macaque or mouse. +TR present in mouse, but not in human or Rhesus macaque. The results were obtained after analysis of publicly available datasets: GSE124708, GSE110366, GSE233417, GSE120137.
To relate whether the presence of tandem repeats increases the methylation levels in the TR-CGIs, methylation levels of methylated TR-CGIs were compared to their non-TR CGI orthologs, controlling for cell- or tissue-type. Methylation levels of six CGI orthologs of human, Rhesus macaque, and mouse were compared in adipose tissue and the following relationships between orthologs were observed (Fig. 6B; Supplementary Table S7; Supplementary Fig. S11): (1) human PRKXP1 and SHC2 TR-CGIs are methylated, and the Rhesus ortholog was without TR and significantly undermethylated; both Rhesus and mouse SHC2 orthologs that were without TRs were unmethylated; (2) human and Rhesus C5orf47 and KCNG2 TR-CGIs are methylated and their mouse orthologs lacking TRs are unmethylated or significantly undermethylated; and (3) the mouse Trim52 TR-CGI is methylated and the human non-TR ortholog is unmethylated31–33. Further analysis revealed the association of TRs with the PRKXP1 promoter CGIs of chimpanzee and gorilla, much shorter length (300 bp) in orangutan and their absence in gibbon and the African green monkey. As a second line of evidence connecting TRs to methylation, we found that mouse CGI orthologs of five TR-CGIs methylated in human fibroblasts are unmethylated in both embryonic and adult mouse fibroblasts (Supplementary Figure S12; Supplementary Table S7). Moreover, the mouse TR-CGI of Trim52 is methylated, yet its human non-TR CGI ortholog is unmethylated in fibroblasts.
Frequencies of TR-CGI and non-TR CGI methylation and genomic locations
We used the same BJ fibroblasts25 to determine the relative frequencies of ICR, TR-CGI and non-TR methylation in a single cell type. Using 30% methylation as a cutoff, 27 of 30 (90%) ICRs, 49 of 347 (14%) TR-CGIs, and 505 of 8,113 (6.3%) non-TR-CGIs showed ≥ 30% methylation. These percentages are consistent with those found in different fetal tissues (Fig. 2B and Supplementary Fig. S3). We then mapped the genomic positions of the 505 methylated non-TR CGIs (Fig. 7 and Supplementary Table S8). There are three notable features of their locations. First, they are non-randomly distributed. Second, many are in clusters, with some clusters overlapping TR-CGIs clusters. (The high density of TR-CGIs and methylated non-TR-CGIs on chromosome 19 is striking.) Third, 298 out of 506 (59%) are tightly linked (within 2 Mb) of their nearest neighboring TR-CGI. The cause(s) and significance of these TR- and non-TR CGI relationships are not known.
Fig. 7.

Locations of methylated human non-TR CGIs on ideogram of TR-CGIs. Genomic positions of 506 non-TR CGIs with > 30% methylation in BJ fibroblasts were determined and placed along with positions of TR-CGIs on the human chromosome ideogram. The results were obtained after analysis of publicly available dataset: GSE110366.
Discussion
The identification and analyses of TR-CGI promoters revealed certain similarities and differences with ICRs. The occurrence of TRs itself, clustering of the genes possessing the TR-CGI promoters, methylated states in multiple tissues, and substantial effects on methylation due to spermatogenesis-associated reprogramming are some of the common features. Some distinctive features include broad ranges of methylation levels observed, infrequent ZFP57 binding, variation in methylation levels of a small subset of the TR-CGIs in the same tissues between individuals, tissue-specific differences in methylation, loss of methylation in both types of gametogenesis, gain of methylation after implantation and lack of significant enrichment of H3K9me3 and H3K36me3 (SETDB1-binding sites).
Based on the methylation patterns observed in a sample of TR-CGIs in preimplantation stages, gametes and multiple adult tissues, we postulate that TR-CGI methylation is mainly acquired post-fertilization and can be stably maintained for the entire lifespan of the individual. These methylation patterns are preserved in case of primed iPSCs but not naïve iPSCs, suggesting their lack of sensitivity to the former type of in vitro reprogramming. Given the evidence that methylation levels can influence gene expression in five out of the 23 genes studied in human fibroblasts, the association of primate-specific acquisition of TRs and their increased potential of attaining methylated states that are more evident after implantation suggest that the TR-CGIs also play a role in the hypothetical epigenetic bifurcation events creating canals in the epigenetic landscape of development proposed by Waddington17,34.
As mentioned above, the common structural feature associated with the 342 genes with TR-CGI promoters and ICRs is the presence of tandem repeats that do not share sequences. It appears that the repetitive nature is more likely an explanation for the ability to acquire methylation. Since methylation of certain TR-CGI promoters is associated with significant alterations in gene expression, it is reasonable to expect that there are some commonly shared functional features with the imprinted ICRs. However, a unique feature of ICRs is their difference in methylation levels between the male and female gametes of eutherian mammals. In the case of the TR-CGIs, only 11 out of the 32 sequences tested showed such difference. However, methylation data on more samples or analysis in families is needed to establish whether this gamete-specific difference or parental allele-specific methylation persists.
An interesting feature observed for TRs among the TR-CGIs identified is their gradual appearance at evolutionary branch points that separate strepsirhines from platyrhines, old world from the new world monkeys and hominids from non-hominids. For example, even among the great apes PRKXP1 CGI gained TRs in gorilla (1,100 bp), chimpanzee (2,200 bp) and humans (4,400 bp), but not in the more distant gibbon. In orangutan, there is an indication of the presence of a TR, but the length (300 bp) did not meet the threshold value of 400 bp to be included. In support of the hypothesis that the TRs have a role in imparting methylation to the CGIs they are associated with, methylation levels of the PRKXP1 CGI in humans are much higher than rhesus wherein the ortholog is devoid of TRs. In this context, this hypothesis needs to be tested by a careful examination of the TR-CGIs that have acquired TRs recently in the hominid evolution among the great apes.
In summary, the TR-CGI – associated genes are a unique subset in the human genome with distinctive properties that are similar in some respects but different in others from the ICRs and appear to have a functional role on gene regulation. More detailed analyses are needed to establish their evolutionary significance, if any.
Materials and methods
Identification of TR-CGIs
Promoter-proximal CGIs were identified from the annotated CGI track in the UCSC browser of hg19 and hg38 assemblies using visual inspection of dotplots. In case of an annotation in just one track, or different CGI lengths in the two tracks, the sole or longer CGI was used to deduce the coordinates of the other track ‘s CGI via sequence comparisons. The BLASTN (default) variables for generating dotplots that are then scored for presence of tandem repeats in hg19 and hg38 assemblies: somewhat similar sequences; expect threshold 0.05; word size 11; match/mismatch score 2,−3; existence: 5 extension: 2. TRs within 200 bp of promoter-proximal CGIs ranged in size from < 100 bp to ≥ 400 bp. We chose to limit our studies to the promoter-proximal TRs ≥ 400 bp (defined as TR-CGIs) because of the length similarities to ICRs (example shown in Fig. 1B).
Determining methylation levels in TR-CGI, ICR and non-TR & non-ICR sequences
CGI methylation values as percents or fractions were calculated from human 450 K and EPIC Illumia microarrays, reduced representation bisulfite sequencing (RRBS), and whole genome bisulfite sequencing (WGBS) datasets using annotated CGI coordinates (see above for details concerning TR-CGI coordinates). For comparisons, coordinates for human imprinting control regions (ICRs)26 and for the remaining (non-TR-CGI & non-ICR -associated CGIs), coordinates were derived from the manifest files of the 450 K and EPIC array manifest files.
Estimation of the proportions of sequences with > 30% methylation levels (Fig. 2B)
Violin plots were generated from the methylation values obtained for each sequence among the TR- and non-TR CGIs, and ICRs using PlotsOfData Shiny app (https://huygens.science.uva.nl/PlotsOgData/). Statistical analyses were performed by using the same data using SR plots (https://www.bioinformatics.com.cn/en).
Analysis of ZFP57 binding sites in ICR, Non-TR and TR-CGIs (Fig. 2E)
To test whether there is a significant difference in the number of ZFP57 binding sites in the three categories of sequences (ICRs, TR-CGIs and Non-TR CGIs), we performed Fisher’s exact 2-tailed test to obtain p values which were then subjected to Bonferroni correction. Since three tests were performed, a Bonferroni-corrected threshold p-value of 0.0167 was used. If the obtained p value is lesser than 0.0167, then the difference was inferred as significant.
Evolutionary appearance of TRs in CGI
Promoter-proximal CGI sequences from non-human primate and rodent species, corresponding to human TR-CGIs, were studied to determine the latest evolutionary appearance of each human TR-CGI. Given the limited number of available annotated vertebrate genome sequences, we approximated latest evolutionary appearance to all primates, new-world monkeys (NW), old-world monkeys (OW), apes or humans.
Electronic supplementary material
Below is the link to the electronic supplementary material.
Author contributions
Conceptualization: KNM, JRC. Design of the work: KNM, LK, JRC. Acquisition of data: KNM, AA, LK, JRC. Analysis of data: KNM, LK, JRC. Interpretation of data: KNM, LK, JRC. Writing original draft: KNM, JRC. Preparation of all figures: KNM, JRC. Reviewed manuscript: KNM, AA, LK, JRC.
Funding
Work in KNM lab was supported by grants from BITS Pilani and Centre for Human Disease. Research. AA was supported by a fellowship from BITS Pilani Hyderabad Campus.
Declarations
Competing interests
The authors declare no competing interests.
Data and materials availability
No new sequence data or materials were generated. Results reported in this manuscript were after analysis of the following publicly available GEO DataSets: GSE49828 The DNA methylation landscape of human early embryos. GSE51239 DNA methylation dynamics of the human pre-implantation embryo. GSE76641 DNA Methylation Barcodes in Human Fetal Tissues and Human Induced Pluripotent Stem Cells. GSE76970 Reversion to naïve human pluripotency creates a new methylation landscape devoid of blastocyst or germline memory. GSE80970 Cortical hypermethylation across an extended region spanning the HOXA gene cluster on chromosome 7 is robustly associated with Alzheimer’s disease neuropathology. GSE110366 Profiling the DNA methylation pattern in naïve induced Pluripotent Stem cells and somatic cells. GSE120137 A multi-tissue full lifespan epigenetic clock for mice. GSE124708 Hyperandrogenemia and western-style diet act synergistically on transcription and DNA methylation in visceral adipose tissue of a non-human primate model. GSE129548 CGGBP1 regulates chromatin barrier activity and CTCF occupancy at repeats. GSE175195 TF ChIP-seq from HEK293. GSE175320 Histone ChIP-seq from HEK293. GSE200834 TNRC18 recognizes H3K9me3 to mediate transposable elements silencing at ERV regions. GSE200839 TNRC18 recognizes H3K9me3 to mediate transposable elements silencing at ERV regions. GSE233417 A comprehensive DNA methylation atlas for noncancer human tissue types. GSE247551 SPINDOC promotes genome-wide redistribution of Spindlin1. GSE109559 Cell type and species-specific methylation patterns in neuronal and non-neuronal cells of human and chimpanzee cortex. GSE53261 The relationship between DNA methylation, genetic and expression inter-individual variation in untransformed human fibroblasts.
Footnotes
Publisher’s note
Springer Nature remains neutral with regard to jurisdictional claims in published maps and institutional affiliations.
Contributor Information
K. Naga Mohan, Email: mohankn@hyderabad.bits-pilani.ac.in.
J. Richard Chaillet, Email: Chaillet@pitt.edu.
References
- 1.Eggermann, T. et al. Imprinting disorders. Nat. Rev. Dis. Primers. 9(1), 33 (2023). [DOI] [PubMed] [Google Scholar]
- 2.Hutter, B., Helms, V. & Paulsen, M. Tandem repeats in the CpG islands of imprinted genes. Genomics88(3), 323–332 (2006). [DOI] [PubMed]
- 3.Watanabe, T. et al. Role for PiRNAs and noncoding RNA in de Novo DNA methylation of the imprinted mouse Rasgrf1 locus. Science332 (6031), 848–852 (2011). [DOI] [PMC free article] [PubMed] [Google Scholar]
- 4.Saito, T. et al. A tandem repeat array in IG-DMR is essential for imprinting of paternal allele at the Dlk1-Dio3 domain during embryonic development. Hum. Mol. Genet.27 (18), 3283–3292 (2018). [DOI] [PubMed] [Google Scholar]
- 5.Reinhart, B., Eljanne, M. & Chaillet, J. R. Shared role for differentially methylated domains of imprinted genes. Mol. Cell. Biol.22 (7), 2089–2098 (2002). [DOI] [PMC free article] [PubMed] [Google Scholar]
- 6.Reinhart, B., Paoloni-Giacobino, A. & Chaillet, J. R. Specific differentially methylated domain sequences direct the maintenance of methylation at imprinted genes. Mol. Cell. Biol.26 (22), 8347–8356 (2006). [DOI] [PMC free article] [PubMed] [Google Scholar]
- 7.Lewis, A., Mitsuya, K., Constancia, M. & Reik, W. Tandem repeat hypothesis in imprinting: deletion of a conserved direct repeat element upstream of H19 has no effect on imprinting in the Igf2-H19 region. Mol. Cell. Biol.24 (13), 5650–5656 (2004). [DOI] [PMC free article] [PubMed] [Google Scholar]
- 8.Paoloni-Giacobino, A., D’Aiuto, L., Cirio, M. C., Reinhart, B. & Chaillet, J. R. Conserved features of imprinted differentially methylated domains. Gene399 (1), 33–45 (2007). [DOI] [PMC free article] [PubMed] [Google Scholar]
- 9.Hanna, C. W., Demond, H. & Kelsey, K. Epigenetic regulation in development: is the mouse a good model for the human? Hum. Repro Update. 24 (5), 556–576 (2018). [DOI] [PMC free article] [PubMed] [Google Scholar]
- 10.Takahashi, N. et al. ZNF445 is a primary regulator of genomic imprinting. Genes Dev.33 (1–2), 49–54 (2019). [DOI] [PMC free article] [PubMed] [Google Scholar]
- 11.Borowczyk, E., Mohan, K. N., D’Aiuto, L., Cirio, M. C. & Chaillet, J. R. Identification of a region of the DNMT1 methyltransferase that regulates the maintenance of genomic imprints. Proc Natl. Acad. Sci U S A. 106 (49), 20806–20811 (2009). [DOI] [PMC free article] [PubMed] [Google Scholar]
- 12.McGraw, S. et al. Transient DNMT1 suppression reveals hidden heritable marks in the genome. Nucleic Acids Res.43 (3), 1485–1497 (2015). [DOI] [PMC free article] [PubMed] [Google Scholar]
- 13.Howell, C. Y. et al. Genomic imprinting disrupted by a maternal effect mutation in the Dnmt1 gene. Cell104 (6), 829–838 (2001). [DOI] [PubMed] [Google Scholar]
- 14.Choudhury, S., Anne, A., Singh, M., Chaillet, J. R. & Mohan, K. N. DNMT1 Y495C mutation interferes with maintenance methylation of imprinting control regions. Int. J. Biochem. Cell. Biol.169, 106535 (2024). [DOI] [PubMed] [Google Scholar]
- 15.Ding, F. & Chaillet, J. R. In vivo stabilization of the Dnmt1 (cytosine-5)- methyltransferase protein. Proc Natl. Acad. Sci U S A. 99 (23), 14861–14866 (2002). [DOI] [PMC free article] [PubMed] [Google Scholar]
- 16.Biniszkiewicz, D. et al. Dnmt1 overexpression causes genomic hypermethylation, loss of imprinting, and embryonic lethality. Mol. Cell. Biol.22 (7), 2124–2135 (2002). [DOI] [PMC free article] [PubMed] [Google Scholar]
- 17.Greally, J. M. A user’s guide to the ambiguous word ‘epigenetics’. Nat. Rev. Mol. Cell. Biol.19 (4), 207–208 (2018). [DOI] [PubMed] [Google Scholar]
- 18.Kobayashi, E. H. et al. Genomic imprinting in human placentation. Reprod. Med. Biol.21 (1), 12490. 10.1002/rmb2.12490 (2022). [DOI] [PMC free article] [PubMed] [Google Scholar]
- 19.Adhami, A. Systematic identification of factors involved in the Silencing of germline genes in mouse embryonic stem cells. Nucleic Acids Res.51 (7), 3130–3149 (2023). [DOI] [PMC free article] [PubMed] [Google Scholar]
- 20.Heisler, L. E. et al. CpG Island microarray probe sequences derived from a physical library are representative of CpG Islands annotated on the human genome. Nucleic Acids Res.33 (9), 2952–2961 (2005). [DOI] [PMC free article] [PubMed] [Google Scholar]
- 21.Cross, S. H., Clark, V. H. & Bird, A. P. Isolation of CpG Islands from large genomic clones. Nucleic Acids Res.27 (10), 2099–2107 (1999). [DOI] [PMC free article] [PubMed] [Google Scholar]
- 22.Imbeault, M., Helleboid, P-Y. & Trono, D. KRAB zinc-finger proteins contribute to the evolution of gene regulatory networks. Nature543 (7646), 550–554 (2017). [DOI] [PubMed] [Google Scholar]
- 23.Wagner, J. R. et al. The relationship between DNA methylation, genetic and expression inter-individual variation in untransformed human fibroblasts. Genome Biol Feb. 20 (2), R37 (2014). [DOI] [PMC free article] [PubMed] [Google Scholar]
- 24.Roost, M. S. et al. DNA methylation and transcriptional trajectories during human development and reprogramming of isogenic pluripotent stem cells. Nat. Commun.8 (1), 908 (2017). [DOI] [PMC free article] [PubMed] [Google Scholar]
- 25.Giulitti, S. et al. Direct generation of human Naïve induced pluripotent stem cells from somatic cells in microfluidics. Nat. Cell. Biol.21 (2), 275–286 (2019). [DOI] [PubMed] [Google Scholar]
- 26.Pastor, W. A. et al. Naive human pluripotent cells feature a methylation landscape devoid of blastocyst or germline memory. Cell. Stem Cell.18 (3), 323–329 (2016). [DOI] [PMC free article] [PubMed] [Google Scholar]
- 27.Anne, A., Saxena, S. & Mohan, K. N. Genome-wide methylation analysis of post-mortem cerebellum samples supports the role of peroxisomes in autism spectrum disorder. Epigenomics14 (17), 1015–1027 (2022). [DOI] [PubMed] [Google Scholar]
- 28.Smith, Z. D. et al. DNA methylation dynamics of the human preimplantation embryo. Nature511 (7511), 611–615 (2014). [DOI] [PMC free article] [PubMed] [Google Scholar]
- 29.Guo, H. et al. The DNA methylation landscape of human early embryos. Nature511 (7511), 606–610 (2014). [DOI] [PubMed] [Google Scholar]
- 30.Schrago, C. G. & Voloch, C. M. The precision of the hominid timescale estimated by relaxed clock methods. J. Evol. Biol.26 (4), 746–755 (2013). [DOI] [PubMed] [Google Scholar]
- 31.Carbone, L. et al. Synergistic effects of hyperandrogenemia and obesogenic Western-style diet on transcription and DNA methylation in visceral adipose tissue of nonhuman Primates. Sci. Rep.9 (1), 19232 (2019). [DOI] [PMC free article] [PubMed] [Google Scholar]
- 32.Thompson, M. J. et al. A multi-tissue full lifespan epigenetic clock for mice. Aging (Albany NY). 10 (10), 2832–2854 (2018). [DOI] [PMC free article] [PubMed] [Google Scholar]
- 33.Li, S. Z. et al. Comprehensive tissue Deconvolution of cell-free DNA by deep learning for disease diagnosis and monitoring. Proc. Natl. Acad. Sci. U S A. 120 (28), e2305236120 (2023). [DOI] [PMC free article] [PubMed] [Google Scholar]
- 34.Waddington, C. H. The Strategy of the Genes:a Discussion of some Aspects of Theoretical Biology (Allen & Unwin, 1957).
Associated Data
This section collects any data citations, data availability statements, or supplementary materials included in this article.