

Abstract
Despite social scientists’ long-standing interest in the influences of siblings, previous research has not settled the debates on how relevant sibship size is to child development and whether growing up with more siblings could be beneficial. Using 30 years of longitudinal data and fixed-effects models, this study offers the most comprehensive evidence on how sibship size is tied to cognitive and sociobehavioral development. We also advance the literature by systematically comparing the consequences of gaining a sibling for children with varying ordinal positions. Contrary to prior studies using selective data from limited observation spans, we find that children experience net decreases in cognitive test scores as their family size grows. At the same time, our analysis shows that sibling additions are only important to first- and second-born children’s—not later-born children’s—cognitive development. Even for the first- and second-born, the marginal effect of adding a sibling lessens with each addition. Our results thus demonstrate the time-dependent nature of family resource-dilution processes. For sociobehavioral development, the evidence indicates that having an older sibling is beneficial, but gaining a younger sibling increases behavioral problems for some (e.g., first-born children). Because more children from large families have older siblings, children from larger families exhibit less problematic behavior, on average. By uncovering the complex relationship between siblings and noncognitive development, this study also generally contributes to the sociology of family and inequality.
Keywords: siblings, family size, cognitive development, sociobehavioral development, resource allocation dynamics
Social scientists have long considered the family of origin as the root of disparities in socioeconomic attainment and behavioral propensities (Barber 2000; Blau and Duncan 1967; Chetty et al. 2017; Hansen and Toft 2021; Jonsson et al. 2009; Mare and Maralani 2006; McLanahan and Percheski 2008). Through everyday interactions and resource allocation in children’s formative years, parents with varying economic, social, and cultural capital cultivate their children’s cognitive and non-cognitive skills to differing extents (Calarco 2014; Heckman and Mosso 2014; Lareau 2011; Sandefur, Meier, and Campbell 2006). This unequal development leads children to ultimately differ in educational attainment, occupational status, income, health, and well-being (Chiteji 2010; Edin et al. 2022; Farkas 2003; Mirowsky and Ross 2003). The literature linking family of origin to inequality often focuses on variations in parental characteristics, but a sizable proportion stresses the importance of siblings (Chen 2020; Conley and Glauber 2006; Downey 1995; Downey and Condron 2004; Lu and Treiman 2008; Powell and Steelman 1995), particularly how individuals’ number of siblings affects their outcomes. Arguing that siblings decrease the parental resources available to a child, numerous studies have shown that people with more siblings have worse school performance, lower cognitive test scores, and fewer years of education (Blake 1989a, 1989b; Downey 2001; Kanazawa 2012; Steelman et al. 2002).
Yet some researchers contend that the comparisons of children from large and small families overlook factors differentiating parents from the two types of families, such as their value systems, intelligence, and parenting styles. Rather than sibship size, these parental factors are thought to explain children’s unequal outcomes (Guo and VanWey 1999; Rodgers et al. 2000). To avoid the confounding influences of unobserved family heterogeneity, several studies advocate for using an analytic strategy that exclusively relies on within-family or within-child changes to estimate the consequences of having additional siblings. These studies repeatedly find no statistically significant effect of family size on cognitive development (Guo and VanWey 1999; Sandberg and Rafail 2014; Workman 2017). Critics of these studies, however, maintain that sample selection problems may be responsible for the null findings (Downey et al. 1999; Philips 1999). Guo and VanWey’s (1999) landmark study, for example, is criticized for overselecting families with young mothers. Other analyses with limited observation spans similarly suffer from relying on a small and potentially selective subsample of families that happened to experience an addition of a child during the observation period (e.g., Sandberg and Rafail 2014).
Not only is the debate on the effect of sibship size unsettled, but existing studies also shed limited light on the time-varying process of resource allocation within families. An implicit assumption behind the shift to use within-family changes in sibling composition to estimate sibling effects is that parents adjust their time, attention, and resources for existing children as each new child comes along (Chen 2020; Guo and VanWey 1999). In spite of this assumption, there has been little theoretical development or corresponding analyses about the potentially conditional nature of parental adjustments. How increases in family size affect children may depend on the number of children already in the family. Children born when family resources are already stretched thin by prior children may receive just enough to cover their essential needs. Because parents are unlikely to take away a child’s essential resources for the sake of a newly added child, a sibling addition may be less consequential for later-born children.
The effect of family size may be even more contingent on a child’s birth-order rank when older and younger siblings have heterogeneous implications for resource availability. In the case of noncognitive development, some studies suggest siblings themselves could serve as sociobehavioral resources (Downey and Condron 2004; Downey, Condron, and Yucel 2015), whereas others indicate problem behavior and inferior noncognitive skills with the addition of a younger sibling (Baydar, Hyle, and Brooks-Gunn 1997; Fletcher and Kim 2019). It is possible that for sociobehavioral development, older siblings, with their more mature behavior, might augment a focal child’s resources far more than younger siblings, making the benefits of siblings vary for children of differing ordinal positions.
In this study, we use 30 years of data collected from the biological children of women in the National Longitudinal Study of Youth 1979 (NLSY79) to examine how sibship size is associated with cognitive and sociobehavioral development from early childhood to teen years. We use a similar modeling strategy as earlier longitudinal studies to address the problem of unobserved family heterogeneity, but our study has decided advantages over previous ones, which generally have observation spans of six or fewer years (Baydar et al. 1997; Guo and VanWey 1999; Sandberg and Rafail 2014; Workman 2017). With long-term observations of developmental outcomes from virtually all children of an entire cohort of women, we can avoid overselecting children born to young mothers or missing children born later in each family, which are at the center of contention in the debate about family size (Philips 1999; Steelman et al. 2002). Moreover, having data from a full array of siblings in each family enables us to examine how changes in sibship may be differentially linked to developmental outcomes for children arriving in the family at different times, potentially uncovering the time-dependent nature of family resource allocation. Similarly, we can contrast the developmental experiences of children in the same family to uncover how the presence of older siblings and the arrival of younger siblings may have differing implications. By showing how and which siblings dilute or augment the resources for cognitive and sociobehavioral development, this study sheds important light on the intrafamily dynamics that ultimately contribute to inequality in human development and well-being.
Our study also makes a significant contribution by addressing the link between family size and children’s behavioral problems, as most studies of sibling effects only focus on cognitive skills (Guo and VanWey 1999; Steelman et al. 2002; Workman 2017; Zajonc 2001). Existing analyses of the relevance of sibship size to noncognitive development largely rely on between-family comparisons (Cameron et al. 2013; Downey and Condron 2004; Downey et al. 2015), and their findings are rather mixed (Baydar et al. 1997; Fletcher and Kim 2019). We do not know to what extent unobserved parental characteristics, such as parents’ belief in the importance of social skills or prosocial behavior, account for any observed relationship between family size and sociobehavioral development, or whether it is possible to reconcile the inconsistent findings in previous research. Using longitudinal models to comprehensively examine siblings’ roles in sociobehavioral development, this study offers uniquely rigorous evidence and crucial insights into the debates about siblings and noncognitive development.
THEORIES AND DEBATES ABOUT FAMILY SIZE
Numerous studies have found family size to be inversely related to intellectual or academic outcomes, including IQ scores, reading and writing skills in childhood, high school completion, and college attendance, in the United States and across the world (Blake 1989a, 1989b; Conley 2001; Conley and Glauber 2006; Kalmijn and van de Werfhorst 2016; Kanazawa 2012; Li, Zhang, and Zhu 2008; Powell and Steelman 1993; Sandefur et al. 2006; Yu and Su 2006). To explain this relationship, psychologists Zajonc and Markus (1975) first proposed the confluence theory, which posits that the arrival of each sibling worsens a family’s intellectual milieu, leading to lower intelligence of individuals with more siblings. Later researchers contested the theory’s portrait of intellectual environments for its lack of empirical support. They also challenged the notion that intelligence alone can explain the lower educational achievements of children from large families (Jæger 2009; Kanazawa 2012; Rodgers et al. 2000).
Many sociologists thus opt for the resource-dilution model (Blake 1989a, 1989b; Downey 1995, 2001; Gibbs, Workman, and Downey 2016; Roksa 2019; Steelman et al. 2002). Broader in scope, the model maintains that family resources, including parents’ time, energy, income, and wealth, are finite. When there are more children in the household, each child’s share of the tangible and intangible resources inevitably diminishes, resulting in lower educational resources and achievements for children with more siblings. Consistent with this argument, research shows that parents with more children talk less frequently to each child, have less knowledge about each child’s friends, save less for each child’s college education, and invest less in each child’s extracurricular activities than do parents with fewer children (Downey 1995; Powell and Steelman 1995).
Despite the documented disparities in academic resources and achievements between children from large and small families, some researchers contend that the disparities mainly reflect differences between parents of the two types of families, rather than the effects of having more siblings (Steelman et al. 2002). Parents with certain value systems could simultaneously want fewer children and have higher educational expectations for their children. Such parents may also interact more with their children, learn more about their children’s school and friends, and encourage their children to participate in more extracurricular activities than would other parents, regardless of their number of children. In their influential study, Guo and VanWey (1999) address this concern using change models, or fixed-effects models, which examine how children’s cognitive outcomes change as each sibling arrives, thereby accounting for all unobserved time-invariant family or individual characteristics. With such models, they find no significant effect of family size. A few later studies using individual fixed-effects models reveal similar null findings (Sandberg and Rafail 2014; Workman 2017), supporting the argument that the relationship between sibship size and cognitive development is merely spurious.
Not all researchers find the null effects of sibship size convincing, however. Critics maintain that Guo and VanWey (1999), relying on data of existing children of NLSY79 women from 1986 to 1992, only selected children born to very young mothers, calling into question the study’s generalizability (Philips 1999). Moreover, Guo and VanWey’s use of test scores that are only measured after a child is age 5 or older makes it impossible to estimate the effect of a sibling arriving before the focal child is 5 years old; thus, their analysis merely reflects the consequences of adding a widely spaced sibling, which tends to dilute existing siblings’ resources less (Downey et al. 1999). Although later studies using similar analytic strategies to Guo and VanWey’s addressed these issues (Sandberg and Rafail 2014; Workman 2017), they are still based on an observation period of five or fewer years, during which relatively few children (~12 percent) experience a sibling addition. The low within-child variation in sibship size can lower statistical power for fixed-effects models, leading to biased results (Hill et al. 2019).
Given the high data requirements with change models, some researchers adopted an alternative approach, using twin births or the first two children’s sex composition as an exogenous instrument to identify the causal effects of family size on children’s outcomes (Black, Devereux, and Salvanes 2005, 2010; Cáceres-Delpiano 2006; Conley and Glauber 2006; Diaz and Fiel 2021; Fletcher and Kim 2019; Li et al. 2008; Marteleto and de Souza 2012; Ponczek and Souza 2012). Results generated from this set of studies, however, are mixed, with sibship size negatively affecting children with one instrument but having a negligible effect with another. The sensitivity to the choice of instrument, along with the limited generalizability imposed by the conditions of instrument variables, makes the instrument variable approach less than ideal for settling the debate on the effects of having additional siblings.1
In this study, we use fixed-effects models and 30 years of data to overcome the problems of biased sample selections and insufficient observation spans in previous studies with similar models (Guo and VanWey 1999; Sandberg and Rafail 2014; Workman 2017). If the data problems are indeed the reason for the null findings of earlier research, we can expect the following:
Hypothesis 1: Children will experience relatively lower cognitive development with an increase in family size.
FAMILY RESOURCE ALLOCATION AS A DYNAMIC PROCESS
Proponents of using change models to estimate sibling effects generally base their argument on the importance of addressing unobserved heterogeneity (Guo and VanWey 1999; Workman 2017). Behind the shift to examine intrafamily dynamics, however, is a theoretically important assumption: parents recalibrate and reallocate available resources as their family size grows (Chen 2020). Ultimately, parents with more children must divide their resources more, but their calculations at any given time are likely based only on their existing children. Thus, a child would not face reductions of parental attention or other resources until a new sibling arrives. To be clear, the literature on sibling structures has long suggested that resource dilution can be a within-family process (Blake 1989a, 1989b; Downey 1995). In a cross-sectional framework, researchers tend to use birth order or spacing between siblings to capture this process, while treating family size as a measure of between-family differences. Children with high birth-order rank are thought to fare worse cognitively or academically than their older siblings, because they arrive at a time when there are more siblings to share parental resources (Kristensen and Bjerkedal 2007; Steelman et al. 2002).2 Similarly, individuals with more widely spaced siblings have better educational outcomes because they have more time to enjoy their parents’ attention and investment, before the next child comes and dilutes the parental resources (Powell and Steelman 1993, 1995).
In a longitudinal design focusing on within-family changes, the birth-order effect seems to become conceptually indistinguishable from the family-size effect. After all, the presence of a larger number of siblings at their birth is exactly why later-born children are theorized to fare worse than those born before them.3 But is birth order just a proxy for sibship size? We propose that birth order is critical to our understanding of family-size effects because the extent to which parents reshuffle and redistribute resources may change with each child’s arrival. Despite making references to intrafamily dynamics (Chen 2020; Steelman et al. 2002), prior research on sibling characteristics has offered little conceptual clarity or empirical evidence on the potentially time-dependent process of family resource allocation. We argue that the resources parents can reallocate to meet a new child’s demands are generally restricted, because parents cannot take away resources used to satisfy older children’s essential needs. Even the “spare” resources (Downey 2001) committed to existing children’s nonessential needs (e.g., extracurricular activities) may not be easily retractable. For example, parents could be hesitant to move an older child to a less expensive preschool in spite of new demands. In some cases, such as saving for college funds, parents may see meeting their older child’s need as more urgent and be unwilling to reduce the saving amount even after the birth of a younger child, resulting in uneven savings for their children (Powell and Steelman 1995). Parents may also be reluctant to alter established interaction patterns with existing children. Indeed, research shows that parents model their quality time spent with younger children after the time with older ones, even though younger children need more quality time with parents (Price 2008).
Because parents are constrained by their preestablished commitment or practices, they may not always readjust resources to ensure their n existing children will each receive 1/n of the non-sharable family resources, a division pattern explicitly or implicitly assumed by prior research (Downey 1995, 2001; Steelman et al. 2002). More likely, the way parents adjust their resource allocation with the arrival of each child depends on the number of children they have before the arrival and the spare or transferable resources these children have. To illustrate, Table 1 provides a hypothetical case in which parents’ ability to reallocate resources from preexisting children to a new child is restricted. When this hypothetical family has only one child, the child receives 100 percent of parental resources. Because the parents are unwilling or unable to take some resources, even spare ones, away from their oldest child, the child’s share becomes 60 percent, with the other 40 percent allocated to the second child, when the number of children grows to two. When a third child is added, the parents squeeze more spare resources out of their older children for the youngest one, but the distribution is still unequal among the three children—45, 30, and 25 percent, respectively—because some of the commitment to the older children cannot be altered. At 25 percent, the resources received by the third child are likely just slightly above what the parents deem necessary to cover the child’s essential needs.4 Because essential resources cannot be reallocated, the parents can hardly reduce the third child’s resources when the fourth child arrives. The parents must take a little from each child to meet the fourth child’s essential needs, making the shares of parental resources 35, 25, 20, and 20 percent from their oldest to youngest child.5
Table 1.
An Illustrative Case of Changes in the Share of Family Resources with Sibling Additions
| Number of Children in Family | Child 1 | Child 2 | Child 3 | Child 4 | Total |
|---|---|---|---|---|---|
|
| |||||
| 1 | 100% | 100% | |||
| 2 | 60% | 40% | 100% | ||
| 3 | 45% | 30% | 25% | 100% | |
| 4 | 35% | 25% | 20% | 20% | 100% |
If the scenario illustrated above is close to the way parents distribute resources as their family size and demands change over time, then the effect of having an additional sibling should be conditional on a child’s ordinal position. Moreover, as parents squeeze out increasingly fewer resources for a new child each time, the marginal effect of adding a sibling will also decline for those born early in the family. Thus, we propose the following:
Hypothesis 2: A sibling addition will be less consequential to later-born children’s development than earlier-born children’s.
Hypothesis 3: The first-born child’s development will be more greatly hindered with the arrival of the second child than with the third child, and even less with the next one.
SIBLINGS AND NONCOGNITIVE DEVELOPMENT
The literature on sibship size predominantly focuses on cognitive or educational outcomes (Conley and Glauber 2006; Downey 2001; Guo and VanWey 1999; Kalmijn and van de Werfhorst 2016; Li et al. 2008; Marteleto and de Souza 2012; Sandberg and Rafail 2014; Workman 2017). In the case of cognitive development, parental interactions and investment are likely the main within-family resources cultivating this development. For noncognitive development, however, research suggests siblings may help each other learn social skills and proper behavior, thus augmenting available resources (Downey and Condron 2004; Downey et al. 2015). If this is the case, the process of intrafamily resource allocation for sociobehavioral development could be even more dynamic than that for cognitive development.
The notion that siblings are potential resources is rooted in psychological literature, which has long considered positive interactions with siblings as key to children’s learning social skills (Brody 2004; Dunn 1988; Hughes, McHarg, and White 2018; McHale, Updegraff, and Whiteman 2012). Yet large-scale systematic analyses of sibship size and noncognitive development are rare (Downey and Condron 2004). Most prior studies focus on whether children without siblings (i.e., “only” children) suffer in social and behavioral development. Some find such children are less prosocial and exhibit more problematic behavior than do children with siblings; others find no difference (Cameron et al. 2013; Falbo 2012; Zheng et al. 2022).
In two studies using nationally representative samples to study the benefits of sibship size, Downey and colleagues (Downey and Condron 2004; Downey et al. 2015) show that individuals with one or more siblings are less likely to exhibit problem behavior in kindergarten than are only children, and the former improve more in self-control and interpersonal skills from kindergarten to 5th grade than do the latter. Nevertheless, these researchers do not find having multiple siblings more beneficial than having just one sibling, thus arguing that merely interacting with one sibling meets the threshold for bringing sociobehavioral benefits (Downey and Condron 2004). While insightful, these studies rely on between-family comparisons, which cannot rule out the selectivity of parents with many or few children as an explanation of the children’s differences. Perhaps, for example, parents with three or more children are more traditional and believe in authoritarian parenting practices more than parents with two children. Because such practices could increase children’s conduct problems (Thompson and Hollis 2003), they may offset the social resources contributed by additional siblings, making children with one and many siblings similar in sociobehavioral outcomes.
Further complicating the picture is that earlier research finds children exhibit more adjustment difficulties and behavioral problems after gaining a sibling (Baydar et al. 1997). A recent study using younger twin siblings to estimate the exogenous effect of sibship size on noncognitive skills similarly concludes that sibling additions are detrimental (Fletcher and Kim 2019). Both cases, however, assess the family-size effect with increases in younger siblings. One possibility is that older siblings, with their relative maturity, serve as role models and resources for a child’s sociobehavioral development, whereas younger siblings, whose arrivals necessarily dilute parental attention, are negatively related to noncognitive outcomes. Following our proposed framework of conditional resource dilution on birth order, if a younger sibling’s arrival indeed impedes behavioral development through decreasing parental attention, it should be especially so for first-born children, who have more parental attention to lose and no elder siblings to model. Taking these arguments together, we can expect the following:
Hypothesis 4: Children with more older siblings will have better behavioral development.
Hypothesis 5: Adding a younger sibling will be negatively associated with sociobehavioral development, especially for children without elder siblings.
If later-born children’s behavioral development benefits from having a larger number of older siblings, to the extent it offsets any hinderances their older siblings experience with their arrivals, we could even expect the following:
Hypothesis 6: Children from larger families, on average, will have similar or better behavioral development than children from small families.
SIBLING HETEROGENEITY AND THE USE OF CHANGE MODELS
The possibility that older siblings, but not all siblings, serve as resources for sociobehavioral development makes it necessary to consider the differing meanings between using family and child (individual) fixed-effects models to assess the effect of sibship size. In Guo and VanWey’s (1999) study calling for using fixed-effects models, they merely consider child fixed-effects models as more rigorous than family fixed-effects models, arguing that the former can further account for time-constant between-sibling differences. In reality, family and child fixed-effects models also address different questions. The former concerns whether increases in family size alter the average outcome of all children in the family, which is more similar to the question of whether children from a larger family, on average, fare better or worse. Child fixed-effects models, by contrast, ask how adding a sibling affects the focal child. To better explain the difference, we need to delve into the modeling details. A family fixed-effects model for estimating sibship-size effect can be expressed as follows:
where the dependent variable is the outcome of interest for child at time ; is the intercept; is the total number of siblings in the child’s family at time , with as its coefficient; is a vector of child and family characteristics related to the outcome (e.g., age, gender, and household income); indicates the effects of this vector of variables; denotes unobserved factors that do not vary with time or across siblings for family , in which child is nested; and is the error term. can include various potential confounders, such as the mother’s general childrearing philosophy, interaction styles, intelligence, and personality traits. To estimate with the unobserved factors (or to eliminate ), fixed-effects models transform the equation by subtracting the family means for all included variables. The equation becomes:
where can be interpreted as the extent to which the average child outcome changes from an earlier point of the family cycle (when only one or a few children were born; i.e., ) to a later point (when all or most children were born, i.e., ). If we consider family size as a time-varying concept—that is, a given family can be small at one point and large at a later point—then family fixed-effects models can reveal how children in large families, on average, fare compared to children in small families. Because there are no data points for later-born children in the earlier stage of their family cycle (i.e., before their births), the better or worse average child outcome at the later family cycle stages (i.e., ) can result from either or both of the following changes: (1) the addition of new children to the family, if the new children have very different developmental outcomes from their older siblings, and (2) the earlier-born children’s shifts in developmental outcomes after the arrival of new children.
In contrast to family fixed-effects models, child fixed-effects models are of the following form:
where represents all unobservable child characteristics that do not vary with time. Because could capture unobserved time-invariant between-sibling differences that in the family fixed-effects model cannot, Guo and VanWey (1999) consider child fixed-effects models as the most rigorous and the differences between them and family fixed-effects models as merely about the extent to which they handle unobserved heterogeneity. However, child fixed-effects models differ from family fixed-effects models in other ways, too. Specifically, the former estimate by subtracting the individual means of all variables, transforming the equation as follows:
In this equation, children born last in the family make no contribution to the estimate of , because they never experience changes in sibship size since their birth (i.e., ). In fact, because earlier-born, especially first-born children, are more likely to experience changes in their sibling groups, disproportionately represents the experiences of such children. In other words, child fixed-effects models show how adding a younger sibling is linked to changes in earlier-born children’s outcomes, which does not necessarily tell us how all children in large families fare, compared to those in small families. Conversely, in family fixed-effects models, the family mean of sibship size () is derived from all siblings’ data points over time. With the exception of families that always have only one child, the estimated coefficient of sibship size from family fixed-effects models should incorporate the experiences of all children in the family, as no child’s time-varying sibship size is likely equal to the family mean (i.e., ).
If older siblings augment, but younger siblings dilute, sociobehavioral resources, as we proposed, then child fixed-effects models alone are likely to generate an imperfect understanding about sibship size, as such models entirely overlook older siblings’ effects on their younger siblings. Family fixed-effects models, which factor in later-born children’s own behavior, are necessary to answer how children from large families fare in sociobehavioral development, on average.
METHODS
Data and Outcome Measures
The data for this study come from Rounds 1 to 16 of the NLSY79 Children and Young Adults (NLSY79-CYA), a survey of all biological children of women in the NLSY79 sample. The NLSY79 is an ongoing longitudinal survey of a nationally representative sample of U.S. residents born between 1957 and 1964. The NLSY79-CYA began to collect information from 1986 and has been adding new births and following up with the existing children every other year. By Round 16, conducted in 2016, all NLSY79 women were in their 50s or older, generally past their childbearing years. The 30 years of NLSY79-CYA data used in our study thus include nearly all biological children of an entire cohort of women,6 which enables us to compare how sibling additions may be linked to child development differently for children in the same family. The comprehensiveness of our data also allows us to overcome the criticism of earlier analyses that disproportionately relied on the experiences of children born to young mothers (Guo and VanWey 1999; Philips 1999).
For the statistical analysis, we pooled the 16 rounds of data to create a person-year sample. We also linked this sample with the NLSY79 to obtain detailed information about each child’s mother. With the exception of children born before 1986, the NLSY79-CYA collects children’s information within a couple of years from birth, with biennial follow-ups during their formative years. Because respondents joined the survey in different years, the survey questions each year vary across respondents depending on their age. For evaluations routinely administered for all children within a certain age range (e.g., assessments of cognitive ability), the number of times evaluation results are available is determined by how many times a child was interviewed while within the designated age range.
To uncover the relevance of sibship size to child development, we focus on two outcomes the NLSY79-CYA collected from a very young age and repeatedly. The first is the score of the Peabody Picture Vocabulary Test (PPVT), which measures an individual’s vocabulary and is thought to offer “a quick estimate of verbal ability or scholastic aptitude” (Dunn and Dunn 1981). The PPVT was generally administered to children ages 3 to 18 through 1992 and ages 3 to 15 from 1994 to 2014.7 We used the standard total score provided by the NLSY79-CYA as the dependent variable for the analysis of cognitive development.8 In Guo and VanWey’s (1999) study based on the same survey (but fewer rounds), they also used the Peabody Individual Achievement Test (PIAT) scores to indicate cognitive development. Because the PIAT is not administered until a child reaches at least 5 years old, some argue it led Guo and VanWey to disproportionately rely on additions of widely spaced siblings (i.e., more than five years) to estimate the effect of sibship size (Downey et al. 1999). To avoid the same problem, we use just PPVT scores to approximate the level of cognitive development.
The second outcome concerns a child’s behavior. The NLSY79-CYA uses the behavior problem index (BPI) developed by Peterson and Zill (1986) to measure sociobehavioral development. The survey generally asks mothers of respondents between ages 4 and 17 to answer a series of age-specific questions about respondents’ social behavior. Areas of problem behavior include antisocial, anxious or depressed, hyperactive, head-strong, dependent, and peer conflicts (Barber and East 2011; Baydar et al. 1997). An index for the extent to which a child exhibits problem behavior is then created from all responses. We used the total standard score based on trichotomous responses to BPI items to capture various subdimensions of problem behavior.9 To contrast with the PPVT results more easily, we added a negative sign to the BPI values, so a higher value represents better sociobehavioral development. Hereafter, mentions of BPI, including in the tables, all refer to the transformed score.
We selected all person-years during which a PPVT score was provided for the models predicting cognitive development and all person-years in which a BPI score is available for the analysis of sociobehavioral development. For most survey years, the BPI was administered for children of a wider age range than the PPVT, so there are more observations with BPI scores. Specifically, the analytic sample for models predicting PPVT scores contains 20,253 person-year observations from 9,479 children born to 4,171 mothers, whereas the sample for the BPI analysis includes 38,802 observations from 9,772 children born to 4,272 mothers. To provide more details, we present the distributions of PPVT and BPI scores in our analytic sample in Figure A1 in the online supplement.
For an ancillary analysis, we introduced three measures from the Home Observation Measurement of the Environment (HOME) segment of the NLSY79-CYA. The HOME contains a long list of items about a child’s physical environment, interactions with parents, and daily activities at home, either reported by the mother or observed by the interviewer. In general, the HOME data are collected from all children since birth and at every round until they reach age 15, with specific questions varying by the child’s age. From the various items, the survey generates an overall home environment index, as well as indexes for cognitive stimulation and emotional support at home, both of which are based on a subset of items. We used these three indexes to assess how changes in sibship size are linked to shifts in parental support, investment, and attention, which helps elucidate any effect of sibship size on development.10
Independent Variables
Our main predictor of interest is sibship size, measured by the total number of biological children of each respondent’s mother during the observed year.11 We generally measured sibship size as a continuous variable, although categorical dummies for sibship size were created for models that examine how the change from one to two children may differ from the change from two to three or more children. Of course, some families may have additional nonbiological children present, which could dilute household resources, whereas others may have biological children not living with the mother, who hardly consume the family’s resources. We therefore created two additional variables, the number of additional children at home and the number of siblings away from home, by comparing the number of biological children with the mother’s report of the number of children in the household during the NLSY79 interview.
To show how having an older sibling may be tied to development differently from adding a younger sibling, we further constructed a variable indicating whether a child has (1) zero, (2) one, (3) two, or (4) three or more older siblings. We also used this variable to identify a child’s birth-order rank. Because research indicates that having closely spaced siblings to compete for parental resources is especially detrimental to academic achievements (Steelman et al. 2002), we included a binary indicator for having a younger or older sibling whose birth was close to the focal child’s (≤ 2 years). Although this indicator could vary within individuals in theory—for example, a person could have no closely spaced sibling until a sibling arrives 1.5 years after the person’s birth—our models of developmental outcomes do not include observations before respondents turned 2 years old; thus we are unable to capture any within-person change in the indicator.12 For this reason, both the number of older siblings and having a closely spaced sibling were included in the family fixed-effects models but eliminated from the child fixed-effects models predicting cognitive and sociobehavioral development.
All models in the study control for the child’s gender, age, race/ethnicity, and family structure. The NLSY79-CYA recorded gender as a binary indicator (male versus female) and only once, so we constructed the variable accordingly. We measured age in years and in quadratic form to capture the potentially nonlinear process of development. The survey treats race/ethnicity as time-constant, asking respondents to self-identify their race/ethnicity only in their first interview past 14 years of age. Based on their responses, we divided respondents into five categories: (1) non-Hispanic White, (2) non-Hispanic Black, (3) Hispanic, (4) Asian and Pacific Islander, and (5) other. For respondents who were younger than 14 in 2016 and never identified their race/ethnicity, we used their mother’s and siblings’ ethnoracial identities to jointly determine their race/ethnicity. When the mother and siblings all have the same ethnoracial identity, we assigned the same identity to the child whose identity was unknown. In a small number of cases where the mother and siblings have different identities, we grouped the respondents with “other.”13 We measured family structure, a time-varying variable, with five mutually exclusive categories: (1) living with two biological parents, (2) living with the mother only, (3) living with the father only, (3) living with adoptive parents or only other relatives, (4) living on one’s own, and (5) other. Although time-constant for individuals, gender and race/ethnicity were included in family fixed-effects models to capture sibling differences in gender and ethnoracial identities (e.g., when having mixed-race/ethnicity parents).
To account for changes in parental resources over time, our models include several time-varying controls for mothers’ socioeconomic conditions, such as their years of education, work status, marital status, and family income.14 We used three categories for maternal work status: (1) no job, (2) employed for 30 or fewer hours per week, and (3) employed for more than 30 hours per week. Family income is based on the mother’s report (in the NLSY79) of her household’s annual income. We took the natural log of family income because its distribution is rather skewed. For a small number of observations with no valid values for family income (<1 percent), we coded the variable with the sample mean and included a dummy variable for missing family income. Because marriage can potentially enhance the stability of family resources, we also included a binary indicator representing whether the mother was married at the time of observation. In addition to the time-varying characteristics, we created a variable indicating whether the child was born during the mother’s teenage years, given that teen childbearing has been linked to worse outcomes for offspring (Hofferth and Reid 2002). This variable is time-constant for individuals but varies across siblings within the same family.
Finally, our models account for whether respondents resided in urban areas and their region of residence, both of which could affect the environmental resources available for their development. The NLSY79-CYA does not provide information about urbanization level or region of respondents’ residence until they turn 14 years old. We used mothers’ information for the earlier years if children were living with their mothers; otherwise, we coded their locations as unknown. We relied on census definitions for urban areas and the four major regions (Northeast, Midwest, South, and West). Table 2 presents descriptive statistics based on the person-year observations included in our analysis.
Table 2.
Descriptive Statistics of the Analytic Sample
| PPVT Subsample |
BPI Subsample |
|||
|---|---|---|---|---|
| Mean/Percentage | SD | Mean/Percentage | SD | |
|
| ||||
| PPVT or BPI score | 95.68 | (19.66) | −102.92 | (15.11) |
| Sibship size | 2.67 | (1.22) | 2.71 | (1.23) |
| Birth order (%) | ||||
| First | 42.1 | 40.3 | ||
| Second | 34.6 | 34.9 | ||
| Third | 15.4 | 16.3 | ||
| Fourth or later | 7.9 | 8.5 | ||
| Next sibling closely spaced (%) | 41.9 | 40.7 | ||
| Extra no. of children at home | .02 | (.13) | .02 | (.12) |
| No. of siblings not at home | .14 | (.34) | .15 | (.36) |
| Male (%) | 50.9 | 51.1 | ||
| Age | 7.63 | (3.23) | 8.8 | (3.09) |
| Race/ethnicity (%) | ||||
| White | 70.6 | 72.4 | ||
| African American | 18.1 | 16.5 | ||
| Hispanic | 7.4 | 6.8 | ||
| Native American | 1.3 | 1.2 | ||
| Asian and Pacific Islander | .7 | .8 | ||
| Other | 2.0 | 2.3 | ||
| Family structure (%) | ||||
| Two-parent household | 64.3 | 63.8 | ||
| Single-mother household | 32.3 | 31.9 | ||
| Single-father household | .8 | 1.0 | ||
| Adoptive parents/other relatives | .6 | .5 | ||
| Own independent residence | <.1 | <.1 | ||
| Other | 1.9 | 2.8 | ||
| Mother’s education | 13.00 | (2.41) | 13.23 | (2.47) |
| Born to teen mother (%) | 12.3 | 10.3 | ||
| Mother’s work status (%) | ||||
| No job | 37.4 | 34.5 | ||
| Working <30 hours/week | 15.6 | 16.1 | ||
| Working >30 hours/week | 47.0 | 49.4 | ||
| Log family income | 10.36 | (1.38) | 10.47 | (1.41) |
| Missing family income (%) | .8 | .8 | ||
| Mother currently married (%) | 71.1 | 72.1 | ||
| Residence (%) | ||||
| Rural | 25.0 | 25.8 | ||
| Urban | 69.6 | 67.4 | ||
| Unknown | 5.4 | 6.8 | ||
| Region (%) | ||||
| Northeast | 16.3 | 16.8 | ||
| Midwest | 29.0 | 28.9 | ||
| South | 34.3 | 33.0 | ||
| West | 16.7 | 16.1 | ||
| Unknown | 3.7 | 5.1 | ||
| N | 20,253 | 38,802 | ||
Note: The unit of analysis is person-years, so the distributions are shaped by both the number of respondents in each cell and the number of years respondents appear in the sample. “PPVT” refers to the standard Peabody Picture Vocabulary Test score. “BPI” refers to the transformed standard Behavior Problem Index score, with a higher value indicating better sociobehavioral development. The NLSY-CYA longitudinal weights were applied to calculate the statistics. Standard deviations (SD) are only shown for variables for which the mean is presented.
Analytic Strategies
Because a major debate about sibship size centers on the use of change models versus the more typical option, ordinary least squares (OLS) regressions (Downey et al. 1999; Guo and VanWey 1999), our analysis began with three different types of models—OLS regression, family fixed-effects, and child fixed-effects models—predicting developmental outcomes. We also performed an ancillary analysis, with similar models, showing how children’s home dynamics, cognitive stimulation, and emotional support from parents change with increases in family size. As discussed earlier, family and child fixed-effects models differ in the questions they address and in whether they reflect all children’s or mostly earlier-born children’s experiences. A comparison of results between the two types of models is necessary to illuminate how and for whom increases in family size have implications for development.
Next, we used family fixed-effects models to investigate the potentially heterogeneous effects of having older and younger siblings. Because the number of older siblings is time-constant for an individual, only family fixed-effects models can allow the comparison of how older and younger siblings may be associated with development. Adding the number of older siblings—which is the same as the birth-order rank—in family fixed-effects models also enables us to identify developmental differences between earlier- and later-born children within the same family. We can then show the extent to which these differences, as opposed to shifts in earlier-born children’s outcomes with new siblings’ arrivals, may explain why children’s average outcomes change as family size grows. In addition, we fitted child fixed-effects models for children with different ordinal positions to test whether the effect of sibling additions depends on birth order. Finally, we analyzed whether the extent of resource dilution varies with each addition of a child from the earlier-born children’s perspectives, similarly using child fixed-effects models.
Because the NLSY79 oversampled certain minority groups, and because both the NLSY79 and NLSY79-CYA had attritions over time, we applied the NLSY79-CYA longitudinal weights, which are specific for each child in the survey, to adjust for both.15 Corresponding to the use of weights, we estimated the models with robust standard errors, which also helps handle the non-independence among observations from the same individuals.
RESULTS
Importance of Siblings to Cognitive and Behavioral Development
Table 3 presents OLS, family fixed-effects, and child fixed-effects models predicting PPVT and BPI scores separately. Starting from the results concerning cognitive development (PPVT), the OLS regression shows an inverse relationship between sibship size and PPVT scores, consistent with prior research using similar models to examine intellectual or academic outcomes. Once time-constant between-family differences are taken into account, as in the case of the family fixed-effects model, the coefficient for sibship size becomes smaller, but it remains negative and statistically significant. This finding indicates that within the same family, children’s average cognitive development worsens as family size grows. Sibship size continues to be negatively associated with PPVT scores in the child fixed-effects model, indicating that children experience a net loss in cognitive test scores after they gain a sibling. The results from family and child fixed-effects models directly contradict previous studies that use similar methods but smaller and more selective samples (Guo and VanWey 1999; Sandberg and Rafail 2014; Workman 2017).16 Rather than the effect of sibship size on cognitive development being spurious, our generally consistent findings across models support Hypothesis 1, suggesting that having a large number of siblings hinders cognitive development. To the extent that variation in cognitive development reflects family resources available to children, results from the PPVT models in Table 3 also offer support for the resource-dilution theory.
Table 3.
Comparison of Various Models Predicting Cognitive and Sociobehavioral Development
| PPVT |
BPI |
|||||
|---|---|---|---|---|---|---|
| OLS | Family FE | Child FE | OLS | Family FE | Child FE | |
|
| ||||||
| Sibship size | −2.239*** (.145) | −1.897*** (.323) | −1.330*** (.382) | .372*** (.087) | .877*** (.201) | −.452 (.246) |
| Next sibling closely spaced | −.939** (.317) | −1.640*** (.497) | −.330 (.194) | −.827** (.267) | ||
| Extra no. of children at home | −.076 (1.202) | .632 (1.335) | −.230 (1.353) | .619 (.654) | −.048 (.785) | .460 (.749) |
| No. of siblings not at home | .953* (.464) | 1.786*** (.529) | 1.400* (.593) | −.838** (.290) | 1.420*** (.312) | .235 (.306) |
| Male | −.324 (.284) | −.192 (.311) | −2.466*** (.173) | −2.440*** (.177) | ||
| Age | 2.372*** (.196) | 2.223*** (.177) | 2.300*** (.172) | .381* (.176) | .315* (.140) | .435*** (.128) |
| Age squared | −.097*** (.012) | −.082*** (.011) | −.088*** (.010) | −.025** (.010) | −.022** (.008) | −.025*** (.007) |
| Race/ethnicity (ref. White) | ||||||
| African American | −14.933*** (.35) | −3.361* (1.689) | .639** (.235) | 1.330 (1.089) | ||
| Hispanic | −1.722*** (.463) | −3.015 (1.737) | .756** (.271) | −1.092 (.715) | ||
| Native American | −7.719*** (1.265) | .493 (1.959) | −2.228* (.996) | −.957 (1.386) | ||
| Asian and Pacific Islander | −3.787 (2.064) | −4.036* (2.053) | 4.101*** (.941) | 2.176 (1.306) | ||
| Other | −5.699*** (1.005) | −1.891 (1.300) | .357 (.588) | .555 (.719) | ||
| Family structure (ref. two-parent household) | ||||||
| Single-mother household | −1.148* (.460) | −1.058 (.558) | −1.207 (.672) | −2.498*** (.295) | −.890** (.303) | −.751* (.315) |
| Single-father household | −.912 (2.698) | 3.034 (3.065) | 4.037 (3.495) | −1.674 (1.614) | −1.571 (1.738) | −1.656 (1.826) |
| Adoptive parents/other relatives | −.589 (2.723) | 3.490 (3.146) | 5.097 (3.658) | −.447 (1.520) | −.964 (1.888) | −2.445 (2.065) |
| Own independent residence | −14.643*** (2.24) | −9.543* (4.371) | −17.745** (5.969) | −.568 (4.790) | 4.451 (5.222) | −4.666 (4.295) |
| Other | −1.353 (2.584) | 1.873 (2.914) | 1.602 (3.410) | 1.659 (1.099) | −.351 (1.250) | −1.250 (1.214) |
| Mother’s education | 1.846*** (.075) | −.014 (.309) | −.034 (.292) | 767*** (.041) | −.001 (.154) | −.347* (.165) |
| Born to teen mother | −.704 (.368) | −.080 (.438) | −2.328*** (.282) | −1.818*** (.319) | ||
| Mother’s work status (ref. no job) | ||||||
| Working ≤30 hours/week | .914 (.460) | −1.307* (.516) | −1.243* (.537) | 1.243*** (.266) | .440 (.263) | .214 (.232) |
| Working >30 hours/week | −.768* (.322) | −1.061** (.403) | −.706 (.409) | .682*** (.201) | .446 (.228) | .141 (.210) |
| Log family income | 541*** (.134) | −.193 (.121) | −.172 (.135) | .584*** (.075) | .009 (.071) | −.078 (.066) |
| Missing family income | −1.631 (1.267) | −.797 (1.304) | −1.154 (1.268) | −2.327* (.989) | −.959 (.957) | −1.253 (.871) |
| Mother currently married | 1.959*** (.487) | .913 (.542) | .129 (.592) | 1.894*** (.320) | .960** (.360) | 1.001** (.336) |
| Residence (ref. rural) | ||||||
| Urban | .823* (.339) | .270 (.528) | .068 (.583) | −.337 (.209) | −.477 (.277) | −.217 (.253) |
| Unknown | −.346 (1.247) | −.443 (1.278) | −.982 (1.528) | 1.095 (.655) | .520 (.583) | .657 (.552) |
| Region (ref. Northeast) | ||||||
| Midwest | −.143 (.467) | −.960 (1.600) | −.346 (1.881) | −.946*** (.265) | .495 (.780) | .325 (.710) |
| South | −3.102*** (.455) | −1.143 (1.345) | −.548 (1.778) | −1.613*** (.263) | −.080 (.688) | .262 (.643) |
| West | −1.263* (.527) | −2.394 (1.552) | −1.890 (1.816) | −1.475*** (.307) | 1.182 (.908) | 1.692 (.877) |
| Unknown | .887 (2.411) | −2.623 (2.865) | −3.543 (3.234) | −4.070*** (1.149) | −.326 (1.390) | .621 (1.379) |
| Constant | 64.850*** (1.740) | 94.357*** (4.460) | 91.247*** (4.342) | −119.481*** (1.158) | −105.480*** (2.271) | −98.892*** (2.403) |
| N | 20,253 | 20,253 | 20,253 | 38,802 | 38,802 | 38,802 |
Note: Values in parentheses are robust standard errors. The NLSY79-CYA’s (child-specific) longitudinal weights were applied in estimating all models. “OLS” stands for ordinary least squares and “FE” for fixed-effects models. “PPVT” refers to the standard Peabody Picture Vocabulary Test score. “BPI” refers to the transformed standard Behavior Problem Index score, with a higher value indicating better sociobehavioral development.
p < .05
p < .01
p < .001 (two-tailed tests).
Aside from the finding about sibship size, several other results in the PPVT models are consistent with the resource-dilution model. Children with a sibling very close in age score lower in PPVT scores in both OLS and family fixed-effects models, and this pattern is more pronounced in the latter model, which accounts for between-family differences. Having biological siblings not living in the same home, which potentially increases the share of family resources for each remaining child, is positively associated with PPVT scores across all models. Both findings suggest that having fewer competitors for parental resources enhances a child’s cognitive skills.
The models predicting BPI scores present a somewhat different picture. The OLS regression model shows a positive relationship between sibship size and our transformed BPI scores; thus, children with more siblings exhibit better social behavior. This pattern is repeated in the family fixed-effects model, which accounts for many potential differences between mothers, such as their childrearing philosophy, interaction styles, and perceptions of child behavior. These findings are consistent with Hypothesis 6 and the notion that siblings can serve as resources to facilitate sociobehavioral development. The child fixed-effects model in Table 3, however, indicates that an additional sibling is negatively linked to behavioral maturity, although the p value for the coefficient is slightly above the .05 significance level. Based on this model, a sibling addition seems to dilute family resources and increase a child’s behavioral problems.
The outwardly inconsistent results between the child and family fixed-effects models of sociobehavioral development were generally repeated in all subdimensions of this development when we disaggregated the BPI measure by subdimension and fitted separate models (see Tables D1, D2, and D3 in the online supplement). What explains these seemingly contradictory results? Do siblings augment or dilute family resources for sociobehavioral development? To answer these questions, we need to consider how family and child fixed-effects models differ. Earlier, we noted that child fixed-effects models show how children’s developmental outcomes change when they gain a younger sibling. If only older siblings, with their relative maturity and independence, serve as resources for sociobehavioral development (e.g., by being a role model), then a child would not benefit from gaining a younger sibling. As a result, a child fixed-effects model could find a non-existent or negative relationship between sibship size and sociobehavioral development. By contrast, family fixed-effects models, which reveal changes for the entire sibling group, take into account the contributions of later-born children to the family’s average behavior. If children added later to the family behave significantly better owing to their older siblings’ influence, a family’s average BPI score could improve as its size grows.
To show whether the differing roles of older and younger siblings may explain the contradictory BPI results between the child and family fixed-effects models, we add the number of older siblings to the family fixed-effects models and present them in Table 4, with some coefficients of control variables omitted to conserve space. The BPI model clearly indicates that net of age and various child and family characteristics, children with older siblings exhibit better behavior, which confirms Hypothesis 4. This result suggests that older siblings serve as resources for their younger siblings’ sociobehavioral development. Figure 1 further illustrates the extent of behavioral improvement for each child compared to the sibling immediately before them. The improvement from the second child, who has one elder sibling, to the third one, who has two elder siblings, appears greater than the improvement from the first to second child.17 We see a similar pattern when comparing improvement from the third to fourth child with that from the second to third child. The figure therefore suggests the behavioral benefit of having an older sibling is not just additive. Children with multiple older siblings receive an additional boost for sociobehavioral development, perhaps because the growing number helps create a family environment that normalizes mature behavior.
Table 4.
Family Fixed-Effects Models Predicting Cognitive and Behavioral Development
| PPVT | BPI | |
|---|---|---|
|
| ||
| Sibship size | −1.062** (.352) | .065 (.215) |
| Number of older siblings (ref. zero) | ||
| One | −1.953*** (.332) | .910*** (.182) |
| Two | −2.766*** (.529) | 2.376*** (.264) |
| Three or more | −3.919*** (.801) | 4.159*** (.402) |
| Next sibling closely spaced | −1.830*** (.518) | −.206 (.276) |
| Extra no. of children at home | .580 (1.341) | −.023 (.790) |
| No. of siblings not at home | 1.679** (.531) | 1.090*** (.310) |
| Male | −.196 (.311) | −2.400*** (.176) |
| Age | 2.187*** (.176) | .387** (.140) |
| Age squared | −.084*** (.011) | −.023** (.008) |
| Race/ethnicity (ref. White) | ||
| African American | −3.176 (1.712) | 1.128 (1.082) |
| Hispanic | −2.983 (1.757) | −.837 (.719) |
| Native American | .995 (1.959) | −1.208 (1.390) |
| Asian and Pacific Islander | −3.203 (2.080) | 1.353 (1.310) |
| Other | −1.533 (1.306) | .373 (.725) |
| Family structure (ref. two-parent household) | ||
| Single-mother household | −1.082 (.558) | −.821** (.301) |
| Single-father household | 3.106 (3.027) | −1.249 (1.741) |
| Adoptive parents/other relatives | 3.434 (3.138) | −.585 (1.889) |
| Own independent residence | −1.026* (4.122) | 3.820 (5.156) |
| Other | 2.298 (2.887) | −.571 (1.254) |
| Constant | 90.798*** (4.521) | −102.30*** (2.297) |
| N | 20,253 | 38,802 |
Note: Values in parentheses are robust standard errors. “PPVT” refers to the standard Peabody Picture Vocabulary Test score. “BPI” refers to the transformed standard Behavior Problem Index score, with a higher value indicating better sociobehavioral development. Both models also control for the mother’s characteristics (education, teenage at birth, and work status), log family income, urban residence, and region of residence, same as in the family fixed-effects models presented in Table 3. The NLSY79-CYA’s (child-specific) longitudinal weights were applied in estimating the models.
p < .05
p < .01
p < .001 (two-tailed tests).
Figure 1. Comparisons of Cognitive and Sociobehavioral Development by Order of Birth.
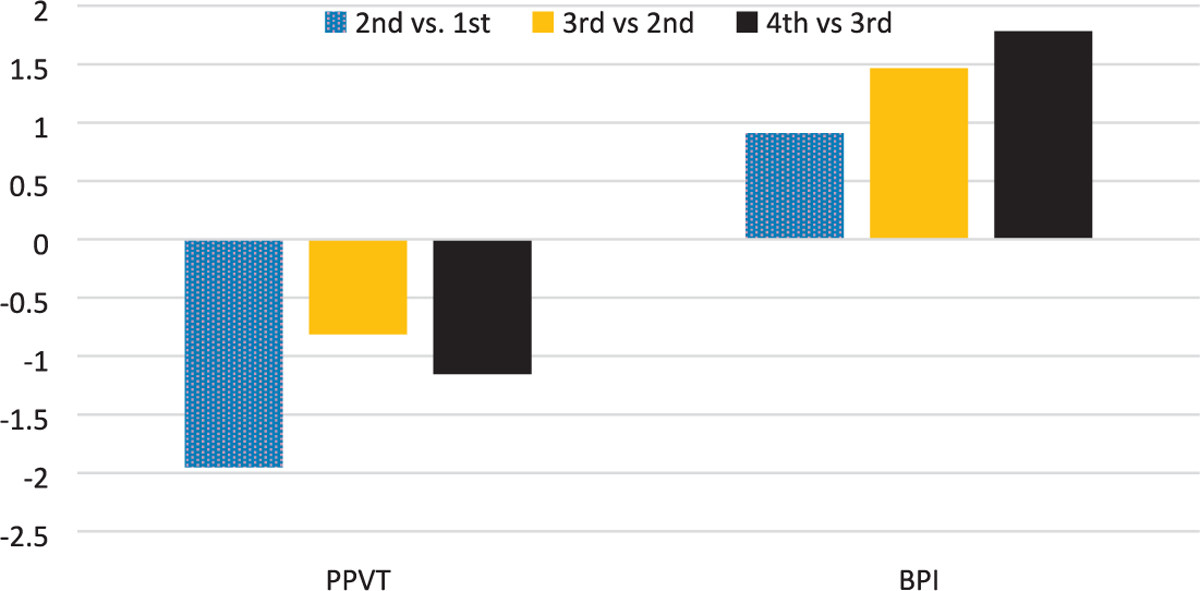
Note: The differences in PPVT and BPI scores are calculated from the models in Table 4. “PPVT” refers to the standard Peabody Picture Vocabulary Test score. “BPI” refers to the transformed standard Behavior Problem Index score, with a higher value indicating better sociobehavioral development.
Compared to the family fixed-effects model for BPI in Table 3, the magnitude of the coefficient of sibship size decreases by 93 percent (.877 – .065)/.877 = .93), making the coefficient in Table 4 small and statistically nonsignificant. Thus, adding the number of older siblings takes away nearly all the positive effect of sibship size on sociobehavioral development shown in the family effects model in Table 3. This means the tendency for children from larger families to exhibit fewer behavioral problems can be almost entirely attributed to later-born children’s better behavior. Because of the superior sociobehavioral development of children with older siblings, especially those with multiple older siblings, children from large families, where there are more children with older siblings, exhibit fewer behavioral problems than those from small families, on average.
Table 4 also presents results from a family fixed-effects model of PPVT scores, with the number of older siblings included. Unlike the model for BPI scores, the coefficient for sibship size remains negative and significant, albeit smaller compared to the family fixed-effects model of the same outcome in Table 3. Thus, in the case of cognitive development, the lower average score for children in larger families is attributable to both later-born children’s worse development and earlier-born children’s deteriorations with the growth of their family size. Figure 1 shows an especially great difference between having no older sibling and just one older sibling, but the decline in PPVT scores from having one to two older siblings or from having two to three older siblings is not statistically different from the average decline experienced by children when they gain a younger sibling (i.e., the coefficient for sibship size, −1.062). In this sense, having an additional older sibling is generally comparable to having a younger sibling as far as the dilution of cognitive resources is concerned.18
Further Evidence on Siblings and Changes in Home Environments and Parental Support
The models presented thus far provide strong evidence on the importance of siblings to cognitive and sociobehavioral development, but we can gain even more confidence if the home environment and parental support experienced by a child indeed change with increases in family size. Table 5 presents a series of fixed-effects models predicting a child’s overall environment, cognitive stimulation, and emotional support at home, with coefficients for control variables omitted. The models indicate that the overall home environment and cognitive stimulation worsen as family size grows. Not only do children experience decreases in home resources and stimulation after a new sibling’s birth, but children with more older siblings to occupy parental attention also experience less optimal home dynamics and intellectual stimulation. These findings are consistent with what we showed earlier about cognitive development: both younger and older siblings dilute the parental resources and attention needed for cognitive development.
Table 5.
Family and Child Fixed-Effects Models Predicting Home Resources and Dynamics
| Home Environment |
Cognitive Stimulation |
Emotional Support |
|||||||
|---|---|---|---|---|---|---|---|---|---|
| Family FE | Child FE | Family FE | Child FE | Family FE Child FE | |||||
|
| |||||||||
| Sibship size | −3.261*** (.262) | −1.354*** (.287) | −.874* (.353) | −3.220*** (.282) | −1.370*** (.306) | −1.369*** (.388) | −1.830*** (.311) | −.435 (.343) | .600 (.434) |
| Number of older siblings (ref. zero) | |||||||||
| One | −4.504*** (.294) | −4.164*** (.314) | −3.203*** (.362) | ||||||
| Two | −6.773*** (.441) | −6.448*** (.471) | −5.053*** (.540) | ||||||
| Three or more | −8.375*** (.658) | −8.093*** (.702) | −5.910*** (.810) | ||||||
| N | 49,864 | 49,864 | 49,864 | 46,894 | 46,894 | 46,894 | 44,099 | 44,099 | 44,099 |
Note: Values in parentheses are robust standard errors. “FE” stands for fixed-effects models. All models contain the same control variables as the ones in the models in Table 3, including the number of additional children at home, number of children away from home, having a closely spaced sibling, age and age squared, family structure, mother’s education and work status, log family income, urban residence, and region of residence. The family fixed-effects models further control for the child’s gender, race/ethnicity, and being born to a teen mother or not. The NLSY79-CYA’s (child-specific) longitudinal weights were applied in estimating the models.
p < .05
p < .01
p < .001 (two-tailed tests).
The child fixed-effects model indicates that gaining a younger sibling is not significantly associated with a loss of emotional support from parents for existing children. The family fixed-effects model with birth order (i.e., the number of older siblings), however, shows that parents provide a lower level of emotional support for their later-born children, although the marginal decline with each child decreases. In an additional analysis presented in the online supplement (Table E1), we found both parental cognitive stimulation and emotional support to be positively linked to sociobehavioral development (emotional support has no statistically significant effect on cognitive development). The fact that both parental stimulation and support decline further for later-born children suggests these children’s relatively better behavior is attributable to the presence of elder siblings. As Table E1 indicates, children from larger families would have had even better sociobehavioral development if later-born children in such families were not subject to their parents’ decreased cognitive stimulation and emotional support.19
Conditional Effects of Sibling Additions
The models presented so far show how the average developmental outcomes of children change with the growth of family size (family fixed-effects models) and the effects of adding a new sibling for existing children (child fixed-effects models). Next, we examine the proposition that family resource allocation is a dynamic process conditional on existing sibship size by fitting child fixed-effects models separately for children of different birth-order positions. Table 6 shows results from the models predicting PPVT and BPI scores, with the coefficients for control variables omitted to conserve space. In our sample, 57.8 percent of respondents are from families that eventually have three or more children, and 27.4 percent are from families with four or more children. We therefore have sufficient numbers of observations to separately examine how shifts in family size are relevant to first-born, second-born, and third- and later-born children. Adding a (younger) sibling is clearly associated with a decrease in PPVT scores for first-born children. The extent of PPVT reduction with a sibling addition seems similar for second-born children, although the statistical significance of the coefficient is weaker (p < .10). By contrast, the arrival of a new sibling has a small and statistically nonsignificant effect on the PPVT score for third- or later-born children, who already have multiple older siblings.20 This pattern is consistent with Hypothesis 2; sibling additions are negatively linked to cognitive development only for earlier-born children. Because parental resources become increasingly restricted as family size grows, third- and later-born children are likely to receive so little nonessential resources that their share can barely be diluted by a new, younger sibling.
Table 6.
Child Fixed-Effects Models Predicting Cognitive and Behavioral Development, by Order of Birth
| PPVT |
BPI |
|||||
|---|---|---|---|---|---|---|
| Order of Birth | 1st | 2nd | 3rd and Later | 1st | 2nd | 3rd and Later |
|
| ||||||
| Sibship size | −1.110* (.539) | −1.292 (.686) | −.069 (.963) | −1.030** (.339) | −.256 (.459) | .106 (.628) |
| Extra no. of children at home | −1.746 (1.814) | 2.679 (2.697) | −1.432 (2.658) | .319 (1.328) | 1.440 (1.170) | −.796 (1.277) |
| No. of siblings not at home | −.229 (1.042) | 1.049 (.967) | 1.853 (1.107) | 1.401* (.589) | .933 (.586) | −.624 (.475) |
| N | 8,771 | 6,669 | 4,813 | 16,006 | 12,874 | 9,922 |
Note: Values in parentheses are robust standard errors. “PPVT” refers to the standard Peabody Picture Vocabulary Test score. “BPI” refers to the transformed standard Behavior Problem Index score, with a higher value indicating better sociobehavioral development. All models also control for age and age squared, family structure, mother’s education and work status, log family income, urban residence, and region of residence, same as in the child fixed-effects models presented in Table 3. The NLSY79-CYA’s (child-specific) longitudinal weights were applied in estimating the models.
p < .05
p < .01
p < .001 (two-tailed tests).
The BPI models in Table 6 indicate that adding a sibling worsens first-born children’s behavior, but it has no statistically significant effect on other children’s sociobehavioral development. The finding that the importance of sibling additions declines from first-born to later-born children is generally in line with Hypothesis 2, although it more specifically supports Hypothesis 5, which expects children with no older siblings (i.e., the first-born) to model to especially experience setbacks in sociobehavioral development with a younger sibling’s arrival. The uneven relevance of sibling additions across children of different birth-order ranks further explains why the child fixed-effects model in Table 3, which includes all children in the sample, shows only a small and marginally significant average decrease in behavioral maturity. The results also suggest that younger siblings, although unable to add to family resources for sociobehavioral development, only dilute such resources from their older siblings on certain occasions.
The child fixed-effects models presented in Table 7 test whether the marginal importance of each sibling addition declines for first- and second-born children (Hypothesis 3). First-born children’s PPVT scores decrease the most after a second child’s birth. The further addition of a third child to the family is associated with a smaller marginal decline in PPVT scores for first-born children (1.717 = |−4.563 – (−2.846)| < |−2.846|; p < .05), and there is no additional decline with the arrival of the fourth child (p > .05 for the difference in the marginal effect). The pattern for second-born children is similar, even though the p values for the coefficients are slightly above the .05 level. With respect to sociobehavioral development, first-born children exhibit a greater decline in this development with the arrival of the second child than with the third child (p < .05), and they are not affected in a statistically significant way by any later additions to their sibling group. Likewise, second-born children’s behavior worsens with the third child’s arrival, but not any later-born children’s (which is why the average effect of sibling additions is nonsignificant in the model for the second-born in Table 6). Overall, Table 7 provides support for Hypothesis 3. Even for first- and second-born children, who are more likely to experience changes in developmental outcomes with additions of younger siblings than are later-born children, the changes become smaller and smaller as each younger sibling is added. Thus, for earlier-born children, most of the resource diversion occurs when they stop being the youngest child in the family; growth in family size after that point is comparatively unimportant.
Table 7.
Child Fixed-Effects Models Concerning Sibship Changes for the First- and Second-Born
| PPVT |
BPI |
|||
|---|---|---|---|---|
| First-Born | Second-Born | First-Born | Second-Born | |
|
| ||||
| Sibship change (ref. none) | ||||
| Adding a 2nd child | −2.846** (.920) | −2.036** (.715) | ||
| Adding the 3rd child | −4.563*** (1.298) | −2.090 (1.135) | −3.302*** (.886) | −1.921* (.758) |
| Adding the 4th (or more) child | −3.705* (1.804) | −2.982 (1.670) | −3.378** (1.153) | −1.454 (1.136) |
| Extra no. of children at home | −1.860 (1.830) | 2.697 (2.696) | .268 (1.326) | 1.377 (1.166) |
| No. of siblings not at home | .042 (1.033) | 1.038 (.966) | 1.478* (.590) | .983 (.585) |
| N | 8,871 | 6,669 | 16,006 | 12,874 |
Note: Values in parentheses are robust standard errors. All models also control for age and age squared, family structure, mother’s education and work status, log family income, urban residence, and region of residence, same as in the child fixed-effects models presented in Table 3. The NLSY79-CYA’s (child-specific) longitudinal weights were applied in estimating the models.
p < .05
p < .01
p < .001 (two-tailed tests).
In a separate analysis not shown here, we interacted the dummies for each sibship change in the models in Table 7 with the eventual family size to see whether first- and second-born children experience different developmental shifts with the addition of their immediate next sibling in families where parents end up with a relatively large family size (i.e., three or four children), compared to families that are always small. We did not find these interactions to have significant effects. This result is consistent with our argument that parents of large families do not plan and save resources for their later-born children; until their family size becomes large, they distribute the most they are able and willing to afford among their existing children, just like parents whose families stay small. Ultimately, family resource allocation is a dynamic process, with all parents needing to recalibrate and reallocate resources as each child is added to the family.
CONCLUSIONS
Despite social scientists’ long-standing interest in the effect of family size on children’s outcomes, prior research on this topic has not settled the debate about the spuriousness of the relationship between the number of siblings and child development. With fixed-effects models, which are empirically more rigorous and theoretically better reflect family resource-allocation processes than do other methods (Guo and VanWey 1999), we show that having an additional sibling—either younger or older—is linked to a lower level of cognitive development. This finding contradicts several earlier studies using similar models but far more selective data (Guo and VanWey 1999; Sandberg and Rafail 2014; Workman 2017), thus countering the argument that the effect of sibship size is merely spurious. Short of setting up an experiment to assign people to have different numbers of children, our analysis has provided as strong evidence as possible to settle the debate about the effect of sibship size on intellectual development.
Beyond addressing an important debate in the literature on family and inequality, our study adds theoretical insights by showing the time-dependent nature of the resource-dilution process. Our analysis indicates that the sibling addition argued to dilute a child’s resources for intellectual development is only relevant for first- or second-born children. Rather than parents always distributing resources among their current children equally, we argue that parents’ inability to reallocate resources committed prior to a new child’s arrival leads them to allocate fewer resources to children born later. As later-born children are likely to receive just enough for their essential needs, further additions of siblings are unlikely to dilute their resources more. Our finding that first- and second-born children experience greater reductions in cognitive test scores with the arrival of their immediate next siblings than do later siblings is also consistent with this portrait of the resource-dilution process.
This research also makes a significant contribution to our knowledge of family structures and noncognitive skills. To our knowledge, this study is the first to use fixed-effects models to comprehensively demonstrate the complex picture about family size and sociobehavioral development. Our analysis indicates that children with older siblings exhibit fewer behavioral problems, suggesting older siblings constitute resources for sociobehavioral development. Having younger siblings, by contrast, does not significantly reduce a child’s likelihood of developing problem behavior. In some cases, such as for first-born and second-born children in regard to the immediate next sibling, adding a younger sibling is actually associated with worse sociobehavioral development. Although younger siblings can dilute older siblings’ sociobehavioral resources, because children with older siblings behave far better, the answer to the question whether children from larger families, on average, have better sociobehavioral development is positive.
The heterogeneous influences of younger and older siblings on sociobehavioral development suggest the implications of growing up in large or small families for this development depend on a child’s birth-order rank. For the first-born, for example, being raised in a family of two children is better than in a family of four children for behavioral growth, because both additional siblings in the latter scenario are younger siblings. A large family, conversely, brings behavioral benefits to the last-born; a last-born child in a family of four children is likely to exhibit fewer behavioral problems than one in a family of two children, who has two fewer older siblings. In this sense, our analysis of both cognitive and sociobehavioral development shows the effects of family size are conditional on birth order, which offers a new conceptual understanding about the importance of a child’s ordinal position. Prior research mostly uses birth order to approximate variation in sibship size within the family life cycle and considers its effects on child outcomes additive to those of family size (Steelman et al. 2002). With such a framework, it is unclear whether birth order remains a meaningful concept—some argue not (Kanazawa 2012; Rodgers 2001)—when researchers can use longitudinal data to directly measure sibling additions and other changes within families. We nevertheless show that more than supplementing the family size effect, birth order plays a crucial moderating role in shaping the consequences of family size increases, because it indicates the constraints parents face and the possible resource augmentation from siblings before each child’s arrival.
Our overall results about the dynamics of family resource allocation have several broader implications. First, because sibling additions are mostly relevant to first- and second-born children’s cognitive development, and because the addition of the immediate next sibling is associated with the most decrease in cognitive test scores for these children, family size is likely to continue to be important to intellectual development and academic outcomes despite fertility declines in the United States. Even in a family of just one or two children, the children would still experience downward shifts in cognitive development with the arrival of another child.
Second, although our analysis is based on U.S. data, the dynamics of resource allocation demonstrated in this study are likely generalizable to other countries. After all, the need for parents to adjust and reallocate resources with each child’s arrival is fairly universal (see Chen 2020). If our results are indeed generalizable, then this research can also illuminate how fertility shifts across the world may affect the comparative consequences of having additional siblings between countries. A recent study, for example, shows that in countries that have experienced greater fertility declines, an increase in siblings is more negatively associated with educational attainment (Choi et al. 2020). Our finding that a sibling addition is the most detrimental to first-born children’s development can explain this pattern perfectly. Because countries with low fertility rates naturally have a larger proportion of first-born children than countries where most families have three or more children, the average disadvantage from gaining a sibling would be greater in the former.
Third, this study suggests that as far as cognitive and sociobehavioral development are concerned, only children do not suffer from their lack of siblings. Although children from larger families behave better than those from smaller families, on average, it is because more children in larger families have benefitted from having older siblings. Because a random sample of people with siblings is likely composed of more non-first-borns than first-borns, we may find the average sociobehavioral development of such people to be superior to those without siblings, as shown in prior research (Downey and Condron 2004; Downey et al. 2015). The counterfactual for only children, however, requires them to experience a sibling addition. Our analysis indicates that first-born children score lower on cognitive tests and exhibit more behavioral problems with the arrival of the next sibling. Thus, while parents may think adding a sibling would bring social benefits to their first and only child, results from our study suggest the opposite.
By showing how family and child fixed-effects models can yield different results, this study makes a methodological contribution to the literature on family size. Because child fixed-effects models rely more on earlier-born children’s experiences, they are not necessarily the best to show how all children in larger families fare compared to those in smaller families. The emphasis on individual changes with sibling additions in child fixed-effects models could also generate an inaccurate understanding when older and younger siblings serve different roles in shaping the amount of resources available to the focal child, as shown in our analysis of sociobehavioral development. In addition, this emphasis could lead researchers to overlook later-born children’s disadvantages owing to their older siblings imposing restrictions on family resources, given that sibling additions barely affect such children’s development. Of course, we do agree with Guo and VanWey (1999) that child fixed-effects models are highly rigorous. Rather than arguing against child fixed-effects models, we demonstrate that researchers can utilize both family and child fixed-effects models to provide more comprehensive evidence for the dynamics of resource allocation and adjustments within families.21
Our study makes important theoretical and methodological contributions, but we face the limitation that a key measure in our study, children’s problem behavior, is based on mothers’ reports. Mothers may tend to rate their younger children as having fewer behavioral problems than their older children, because they are more willing to excuse the former’s behavior. However, the NLSY’s BPI measure has been widely used in research, with much evidence supporting its reliability (Barber and East 2011; Baydar et al. 1997; Carlson and Corcoran 2001). Moreover, if our finding that a later-born child has fewer behavioral problems simply reflects the mother’s bias, it would be difficult to explain why the improvement of BPI scores from the first to the second child appears smaller than that from the second to third child or the third to fourth child. Besides, our result that children in very small families exhibit more problematic behavior than those in larger families, on average, is consistent with other research using teacher-rated behavioral problem indicators (Downey and Condron 2004). Future researchers should nevertheless find more ways to collect data on children’s sociobehavioral development and further verify the role of sibship size.
Related to the need to have more longitudinal measures of sociobehavioral development, this study highlights the importance of expanding the outcomes associated with family size to noncognitive ones. According to our findings, the typical view of the decision about family size as a quantity-quality tradeoff is accurate with respect to cognitive development. With respect to sociobehavioral development, however, our analysis suggests an additional sibling is beneficial for some but detrimental for others. An exhibition of problem behavior, of course, is only one aspect of noncognitive development. It is possible that sibship size is linked to other aspects of this development in a complex way as well. Without more research on the relationship between sibship size and noncognitive outcomes, our understanding of when having additional siblings helps and when it hurts, or for whom adding a sibling is more relevant, is ultimately incomplete.
Supplementary Material
Funding
The first author benefited from facilities and resources provided by the California Center for Population Research at UCLA (CCPR), which receives core support (P2C-HD041022) from the Eunice Kennedy Shriver National Institute of Child Health and Human Development (NICHD). The content is solely the responsibility of the authors and does not necessarily represent the official views of the Eunice Kennedy Shriver National Institute of Child Health & Human Development or the National Institutes of Health.
Biographies
Wei-hsin Yu is Professor in the Department of Sociology at the University of California-Los Angeles, specializing in the areas of social stratification and gender inequality. Her recent work has addressed earnings inequality between women and men, job insecurity and its consequences, family dynamics and sibling disparities, and marriage and relationship formation. She has studied a variety of countries, but most of her research is based on the United States and Japan. She has published two books and numerous articles in academic journals including the American Sociological Review, American Journal of Sociology, Social Forces, and Demography.
Hope Xu Yan is a PhD candidate in Sociology at the University of Maryland-College Park. Her research centers on how social inequalities in health and well-being are (re)produced within families and through workplace dynamics. She conducts research in various societies, including the United States, India, and China.
Footnotes
Twin births and having the first two children of the same sex are both possible instruments, because they tend to increase family size but are unrelated to omitted variables that shape children’s outcomes, such as parental values. Studies using twin births to estimate the effect of adding a sibling, however, may not be generalizable to non-twin families. Likewise, because having two same-sex children is likely a strong predictor of having a third child but not further additions of children (Conley and Glauber 2006), we may not be able to tell the effect of adding a child to families with just one child or more than three children with this instrument.
Alternative theories about birth-order effects, such as prenatal influences and later-born children’s risk-taking tendency, have also been proposed (Steelman et al. 2002; Sulloway 1996), but empirical results tend not to support those theories (Freese, Powell, and Steelman 1999; Kristensen and Bjerkedal 2007).
Birth order is sometimes argued to also represent shifts in parental resources over time, especially in less industrialized countries, where the mother’s total fertility span is longer (Yu and Su 2006). With longitudinal data, however, researchers can directly observe changes in parental conditions, making birth order a less useful indicator of shifts in parental resources over time.
The fact that some family resources (e.g., books) are sharable implies there could be an economy of scale that make later-born children require fewer resources for their essential needs. This, however, does not alter the likelihood that later-born children have limited spare resources to be taken away owing to their parents’ prior commitment to their older siblings. Moreover, in many cases where the economy of scale exists, the quality of resources still declines. For example, three children can share the same amount of mealtime with their parents as required by one child, but each child would receive less adult attention than an only child.
Parental resources may change over time, so 100 percent of parental resources at various points of the family cycle may represent differing amounts. Longitudinal studies can address this issue by controlling for many time-varying parental characteristics. Still, parents could make more sacrifices when there are more children (e.g., having less leisure and sleep time), but time-use research suggests parents can only stretch themselves modestly this way. Mothers, for example, reduce their sleep time by just 8.5 minutes, and leisure time by just 6 minutes, per day with each additional child (Pepin, Sayer, and Casper 2018).
A small proportion of the biological children of the NLSY79 women were identified in the NLSY79-CYA but never interviewed, and thus are missing from our analytic sample.
The survey stopped administering PPVT assessments after 2014, but by 2016 only 2 percent of respondents were age 15 or younger.
The NLSY79-CYA converted respondents’ raw PPVT scores to standard scores using Dunn and Dunn’s (1981) standardized scale, which has a mean value of 100 and a standard deviation of 15 and was developed from a nationally representative sample. The standard scores in our sample range from 0 to 160.
Similar to the standard PPVT score, the standard BPI score is derived from a normalized scale with a mean of 100 and a standard deviation of 15. The original scale was developed from a nationally representative survey in 1981. The standard BPI scores in our sample range from 82 to 182.
Because the HOME segment is administered since a child’s birth, the models with related measures are likely to capture virtually all sibling additions and contain more observations than those for PPVT or BPI. The specific samples for analyzing the overall dynamics, cognitive stimulation, and emotional support at home consist of 49,864, 46,894, and 44,099 observations, respectively.
Research shows that adoptive parents are similar to biological parents in how they invest in their children (Hamilton, Cheng, and Powell 2007), but the NLSY79-CYA unfortunately does not follow nonbiological children. Prior research estimates that a very small proportion (~1 percent) of children of the NLSY79 women, who were born in the 1950s and 1960s, are likely to be adopted (Killewald 2013). More importantly, our inclusion of the number of additional children in the mother’s household in the models should help address the possibility that adopted siblings also affect family resource allocation. Because there is no distinction between adopted children and stepchildren in mothers’ reports of household members, we cannot separately measure the presence of adopted children.
For the child fixed-effect models predicting overall dynamics, emotional support, and cognitive stimulation at home, however, the indicator of having a closely spaced sibling can be included, because those outcomes were measured since each child’s birth.
In a small proportion (<5 percent) of cases, neither respondents nor their siblings reported ethnoracial identities. In such cases, we coded their race/ethnicity as the same with the biological mother’s if the mother is Black or Hispanic. When the mother was simply classified as “non-Black non-Hispanic” in the NLSY79, we grouped respondents without self-identifications as White, given that the NLSY79 has few non-Black non-Hispanic people who are not White. The results did not change when we tried to create a separate category for such respondents or eliminated them from the analysis.
Although it is important to separate the effect of increases in sibship size from that of changes in parental socioeconomic conditions, alterations in the mother’s work status or income could be a reaction to the additions of children, as mothers with more children may devote less time to paid work and earn less (England et al. 2016). Such mothers may also be less able to pursue additional education. To address this possibility, we conducted a separate analysis where we excluded mothers’ education, work status, and family income from all models (see Section B in the online supplement). This exclusion did not lead to meaningful changes in the findings.
Specifically, we used the custom weights generated by the NLSY for all respondents with PPVT or BPI data.
When we limited the sample to the same year range (1986 to 1992) as Guo and VanWey’s (1999), we were able to replicate their finding of a small and statistically nonsignificant coefficient for sibship size, indicating the difference is due to their sample being more restricted (see Table C1 in the online supplement). Moreover, the estimates in Table 3 are generally greater in magnitude than those in Table C1, indicating the changes are not simply due to large standard errors typically observed with small analytic samples.
An F test for coefficient equality indicates the difference is marginally significant. Other references to coefficient differences and p values in the Results section are also based on F test results.
The only exception is for the first-born in the family. For first-born children, “gaining” an older sibling alters their unique position in the sibship structure that allows them to have the parents’ undivided attention during early years, making the hypothetical scenario of adding an older sibling worse for their cognitive development than adding a younger one.
Parental cognitive stimulation and emotional support do not fully explain the changes in PPVT or BPI scores with increases in sibship size (see Table E1 in the online supplement). Perhaps this is because the measures of home dynamics and resources do not capture the aspect of sharing and the related effects. Many of the HOME items, such as the child being taken outside and the frequency with which the child eats meals with the father, cannot distinguish whether the child does the activities with adults alone or together with siblings. Thus, even with measures of home environment, sibship size remains an important predictor of developmental outcomes.
About a quarter of observations contributed to estimation of the coefficient of family size (i.e., the value of the family size not constant for the individual during the observed period) in the model for third- and later-born children. Because a quarter of the observations is sizable (~1,200), and because the nonsignificance of the family size coefficient has to do with the coefficient being small, rather than the standard error being unstable and large, we think our finding that family size is rather irrelevant to cognitive development for third- and later-born children cannot be explained by a lack of statistical power.
As we have shown, although there is no formal way to detect the extent to which different results between family and child fixed-effects models are attributable to the extent of unobserved heterogeneity, a careful comparison can reveal whether the two types of models generate comparable results once one accounts for the differences between siblings of various ordinal positions and experiences of later-born children (who tend to be underrepresented in child fixed-effects models). We can then tell whether the models’ differing capacities to address unobserved heterogeneity are responsible for any discrepancies.
References
- Barber Jennifer S. 2000. “Intergenerational Influences on the Entry into Parenthood: Mothers’ Preferences for Family and Nonfamily Behavior.” Social Forces 79(1):319–48 ( 10.1093/sf/79.1.319). [DOI] [Google Scholar]
- Barber Jennifer S., and East Patricia L. 2011. “Children’s Experiences after the Unintended Birth of a Sibling.” Demography 48(1):101–25 ( 10.1007/s13524-010-0011-2). [DOI] [PMC free article] [PubMed] [Google Scholar]
- Baydar Nazli, Hyle Patricia, and Brooks-Gunn Jeanne. 1997. “A Longitudinal Study of the Effects of the Birth of a Sibling during Preschool and Early Grade School Years.” Journal of Marriage and Family 59(4):957–65 ( 10.2307/353795). [DOI] [Google Scholar]
- Black Sandra E., Devereux Paul J., and Salvanes Kjell G. 2005. “The More the Merrier? The Effect of Family Size and Birth Order on Children’s Education.” Quarterly Journal of Economics 120(2):669–700 ( 10.1093/qje/120.2.669). [DOI] [Google Scholar]
- Black Sandra E., Devereux Paul J., and Salvanes Kjell G. 2010. “Small Family, Smart Family?” Family Size and the IQ Scores of Young Men 45(1):33–58 ( 10.3368/jhr.45.1.33). [DOI] [Google Scholar]
- Blake Judith. 1989a. “Number of Siblings and Educational Attainment.” Science 245(4913):32–36. [DOI] [PubMed] [Google Scholar]
- Blake Judith. 1989b. Family Size and Achievement. Berkeley: University of California Press. [Google Scholar]
- Blau Peter M., and Duncan Otis D. 1967. The American Occupational Structure. New York: John Wiley and Sons. [Google Scholar]
- Brody Gene H. 2004. “Siblings’ Direct and Indirect Contributions to Child Development.” Current Directions in Psychological Science 13(3):124–26 ( 10.1111/j.0963-7214.2004.00289.x). [DOI] [Google Scholar]
- Cáceres-Delpiano Julio. 2006. “The Impacts of Family Size on Investment in Child Quality.” Journal of Human Resources 41(4):738–54. [Google Scholar]
- Calarco Jessica McCrory. 2014. “Coached for the Classroom: Parents’ Cultural Transmission and Children’s Reproduction of Educational Inequalities.” American Sociological Review 79(5):1015–37. [Google Scholar]
- Cameron L, Erkal N, Gangadharan L, and Meng X 2013. “Little Emperors: Behavioral Impacts of China’s One-Child Policy.” Science 339(6122):953–57 ( 10.1126/science.1230221). [DOI] [PubMed] [Google Scholar]
- Carlson Marcia J., and Corcoran Mary E. 2001. “Family Structure and Children’s Behavioral and Cognitive Outcomes.” Journal of Marriage and Family 63(3):779–92 ( 10.1111/j.1741-3737.2001.00779.x). [DOI] [Google Scholar]
- Chen Shuang. 2020. “Parental Investment after the Birth of a Sibling: The Effect of Family Size in Low-Fertility China.” Demography 57(6):2085–111 ( 10.1007/s13524-020-00931-2). [DOI] [PMC free article] [PubMed] [Google Scholar]
- Chetty Raj, Grusky David, Hell Maximilian, Hendren Nathaniel, Manduca Robert, and Narang Jimmy. 2017. “The Fading American Dream: Trends in Absolute Income Mobility since 1940.” Science 356(6336):398–406 ( 10.1126/science.aal4617). [DOI] [PubMed] [Google Scholar]
- Chiteji Ngina. 2010. “Time Preference, Noncognitive Skills and Well Being across the Life Course: Do Noncognitive Skills Encourage Healthy Behavior?” American Economic Review 100(2):200–204. [DOI] [PMC free article] [PubMed] [Google Scholar]
- Choi Seongsoo, Taiji Riley, Chen Manting, and Monden Christiaan. 2020. “Cohort Trends in the Association between Sibship Size and Educational Attainment in 26 Low-Fertility Countries.” Demography 57(3):1035–62 ( 10.1007/s13524-020-00885-5). [DOI] [PMC free article] [PubMed] [Google Scholar]
- Conley Dalton. 2001. “Capital for College: Parental Assets and Postsecondary Schooling.” Sociology of Education 74(1):59–72. [Google Scholar]
- Conley Dalton, and Glauber Rebecca. 2006. “Parental Educational Investment and Children’s Academic Risk: Estimates of the Impact of Sibship Size and Birth Order from Exogenous Variation in Fertility.” Journal of Human Resources XLI(4):722–37 ( 10.3368/jhr.XLI.4.722). [DOI] [Google Scholar]
- Diaz Christina J., and Fiel Jeremy E. 2021. “When Size Matters: IV Estimates of Sibship Size on Educational Attainment in the US.” Population Research and Policy Review 40:1195–220. [Google Scholar]
- Downey Douglas B. 1995. “When Bigger Is Not Better: Family Size, Parental Resources, and Children’s Educational Performance.” American Sociological Review 60(5):746–61. [Google Scholar]
- Downey Douglas B. 2001. “Number of Siblings and Intellectual Development: The Resource Dilution Explanation.” American Psychologist 56(6–7):497–504. [DOI] [PubMed] [Google Scholar]
- Downey Douglas B., and Condron Dennis J. 2004. “Playing Well with Others in Kindergarten: The Benefit of Siblings at Home.” Journal of Marriage and Family 66(2):333–50. [Google Scholar]
- Downey Douglas B., Condron Dennis J., and Yucel Deniz. 2015. “Number of Siblings and Social Skills Revisited among American Fifth Graders.” Journal of Family Issues 36(2):273–96 (). [DOI] [Google Scholar]
- Downey Douglas B., Powell Brian, Steelman Lala Carr, and Pribesh Shana. 1999. “Much Ado about Siblings: Change Models, Sibship Size, and Intellectual Development.” American Sociological Review 64(2):193–98. [Google Scholar]
- Dunn Judy. 1988. “Sibling Influences on Childhood Development.” Journal of Child Psychology and Psychiatry 29(2):119–27 ( 10.1111/j.1469-7610.1988.tb00697.x). [DOI] [PubMed] [Google Scholar]
- Dunn Lloyd M., and Dunn Leota M. 1981. Peabody Picture Vocabulary Test-Revised. American Guidance Service, Incorporated. [Google Scholar]
- Edin Per-Anders, Fredriksson Peter, Nybom Martin, and Öckert Björn. 2022. “The Rising Return to Noncognitive Skill.” American Economic Journal: Applied Economics 14(2):78–100 ( 10.1257/app.20190199). [DOI] [Google Scholar]
- England Paula, Bearak Jonathan, Budig Michelle J., and Hodges Melissa J. 2016. “Do Highly Paid, Highly Skilled Women Experience the Largest Motherhood Penalty?” American Sociological Review 81(6):1161–89 ( 10.1177/0003122416673598). [DOI] [Google Scholar]
- Falbo Toni. 2012. “Only Children: An Updated Review.” Journal of Individual Psychology 68(1):38–49. [Google Scholar]
- Farkas George. 2003. “Cognitive Skills and Noncognitive Traits and Behaviors in Stratification Processes.” Annual Review of Sociology 29(1):541–62 ( 10.1146/annurev.soc.29.010202.100023). [DOI] [Google Scholar]
- Fletcher Jason M., and Kim Jinho. 2019. “The Effect of Sibship Size on Non-cognitive Skills: Evidence from Natural Experiments.” Labour Economics 56:36–43 ( 10.1016/j.labeco.2018.11.004). [DOI] [Google Scholar]
- Freese Jeremy, Powell Brian, and Steelman Lala Carr. 1999. “Rebel without a Cause or Effect: Birth Order and Social Attitudes.” American Sociological Review 64(2):207–31. [Google Scholar]
- Gibbs Benjamin G., Workman Joseph, and Downey Douglas B. 2016. “The (Conditional) Resource Dilution Model: State- and Community-Level Modifications.” Demography 53(3):723–48 ( 10.1007/s13524-016-0471-0). [DOI] [PubMed] [Google Scholar]
- Guo Guang, and VanWey Leah K. 1999. “Sibship Size and Intellectual Development: Is the Relationship Causal?” American Sociological Review 64(2):169–87. [Google Scholar]
- Hamilton Laura, Cheng Simon, and Powell Brian. 2007. “Adoptive Parents, Adaptive Parents: Evaluating the Importance of Biological Ties for Parental Investment.” American Sociological Review 72(1):95–116. [Google Scholar]
- Hansen Marianne Nordli, and Toft Maren. 2021. “Wealth Accumulation and Opportunity Hoarding: ClassOrigin Wealth Gaps over a Quarter of a Century in a Scandinavian Country.” American Sociological Review 86(4):603–38. [Google Scholar]
- Heckman James J., and Mosso Stefano. 2014. “The Economics of Human Development and Social Mobility.” Annual Review of Economics 6(1):689–733. [DOI] [PMC free article] [PubMed] [Google Scholar]
- Hill Terrence D., Davis Andrew P., Roos J. Micah, and French Michael T. 2019. “Limitations of Fixed-Effects Models for Panel Data.” Sociological Perspectives 63(3):357–69 ( 10.1177/0731121419863785). [DOI] [Google Scholar]
- Hofferth Sandra L., and Reid Lori. 2002. “Early Childbearing and Children’s Achievement and Behavior over Time.” Perspectives on Sexual and Reproductive Health 34(1):41–49 ( 10.2307/3030231). [DOI] [PubMed] [Google Scholar]
- Hughes Claire, McHarg Gabrielle, and White Naomi. 2018. “Sibling Influences on Prosocial Behavior.” Current Opinion in Psychology 20:96–101 ( 10.1016/j.copsyc.2017.08.015). [DOI] [PubMed] [Google Scholar]
- Jæger Mads Meier. 2009. “Sibship Size and Educational Attainment: A Joint Test of the Confluence Model and the Resource Dilution Hypothesis.” Research in Social Stratification and Mobility 27(1):1–12 ( 10.1016/j.rssm.2009.01.002). [DOI] [PMC free article] [PubMed] [Google Scholar]
- Jonsson Jan O., Grusky David B., Matthew Di Carlo Reinhard Pollak, and Brinton Mary C. 2009. “Microclass Mobility: Social Reproduction in Four Countries.” American Journal of Sociology 114(4):977–1036 ( 10.1086/596566). [DOI] [PubMed] [Google Scholar]
- Kalmijn Matthijs, and van de Werfhorst Herman G. 2016. “Sibship Size and Gendered Resource Dilution in Different Societal Contexts.” PloS One 11(8):e0160953–e53 ( 10.1371/journal.pone.0160953). [DOI] [PMC free article] [PubMed] [Google Scholar]
- Kanazawa Satoshi. 2012. “Intelligence, Birth Order, and Family Size.” Personality and Social Psychology Bulletin 38(9):1157–64 ( 10.1177/0146167212445911). [DOI] [PubMed] [Google Scholar]
- Killewald Alexandra. 2013. “A Reconsideration of the Fatherhood Premium: Marriage, Coresidence, Biology, and Fathers’ Wages.” American Sociological Review 78(1):96–116 ( 10.1177/0003122412469204). [DOI] [Google Scholar]
- Kristensen Petter, and Bjerkedal Tor. 2007. “Explaining the Relation between Birth Order and Intelligence.” Science 316(5832):1717 ( 10.1126/science.1141493). [DOI] [PubMed] [Google Scholar]
- Lareau Anette. 2011. Unequal Childhoods: Class, Race, and Family Life. Berkely: University of California Press. [Google Scholar]
- Li Hongbin, Zhang Junsen, and Zhu Yi. 2008. “The Quantity-Quality Trade-Off of Children in a Developing Country: Identification Using Chinese Twins.” Demography 45(1):223–43. [DOI] [PMC free article] [PubMed] [Google Scholar]
- Lu Yao, and Treiman Donald J. 2008. “The Effect of Sibship Size on Educational Attainment in China: Period Variations.” American Sociological Review 73(5):813–34. [Google Scholar]
- Mare Robert D., and Maralani Vida. 2006. “The Intergenerational Effects of Changes in Women’s Educational Attainments.” American Sociological Review 71(4):542–64. [DOI] [PMC free article] [PubMed] [Google Scholar]
- Marteleto Letícia J., and de Souza Laetícia R. 2012. “The Changing Impact of Family Size on Adolescents’ Schooling: Assessing the Exogenous Variation in Fertility Using Twins in Brazil.” Demography 49(4):1453–77 ( 10.1007/s13524-012-0118-8). [DOI] [PMC free article] [PubMed] [Google Scholar]
- McHale Susan M., Updegraff Kimberly A., and Whiteman Shawn D. 2012. “Sibling Relationships and Influences in Childhood and Adolescence.” Journal of Marriage and Family 74(5):913–30 ( 10.1111/j.1741-3737.2012.01011.x). [DOI] [PMC free article] [PubMed] [Google Scholar]
- McLanahan Sara, and Percheski Christine. 2008. “Family Structure and the Reproduction of Inequalities.” Annual Review of Sociology 34(1):257–76 ( 10.1146/annurev.soc.34.040507.134549 ). [DOI] [Google Scholar]
- Mirowsky John, and Ross Catherine E. 2003. Education, Social Status, and Health: Social Institutions and Social Change. Hawthorne, NY: Aldine De Gruyter. [Google Scholar]
- Pepin Joanna R., Sayer Liana C., and Casper Lynne M. 2018. “Marital Status and Mothers’ Time Use: Childcare, Housework, Leisure, and Sleep.” Demography 55(1):107–33. [DOI] [PMC free article] [PubMed] [Google Scholar]
- Peterson James L., and Zill Nicholas. 1986. “Marital Disruption, Parent-Child Relationships, and Behavior Problems in Children.” Journal of Marriage and Family 48(2):295–307 ( 10.2307/352397). [DOI] [Google Scholar]
- Philips Meredith. 1999. “Sibship Size and Academic Achievement: What We Now Know and What We Still Need to Know.” American Sociological Review 64(2):188–92. [Google Scholar]
- Ponczek Vladimir, and Souza Andre Portela. 2012. “New Evidence of the Causal Effect of Family Size on Child Quality in a Developing Country.” Journal of Human Resources 47(1):64–106 ( 10.3368/jhr.47.1.64). [DOI] [Google Scholar]
- Powell Brian, and Steelman Lala Carr. 1993. “The Educational Benefits of Being Spaced Out: Sibship Density and Educational Progress.” American Sociological Review 58(3):367–81. [Google Scholar]
- Powell Brian, and Steelman Lala Carr. 1995. “Feeling the Pinch: Child Spacing and Constraints on Parental Economic Investments in Children.” Social Forces 73(4):1465–86 ( 10.2307/2580455). [DOI] [Google Scholar]
- Price Joseph. 2008. “Parent-Child Quality Time: Does Birth Order Matter?” Journal of Human Resources 43(1):240–65. [Google Scholar]
- Rodgers Joseph L. 2001. “What Causes Birth Order–Intelligence Patterns? The Admixture Hypothesis, Revived.” American Psychologist 56(6–7):505–10 ( 10.1037//0003-066x.56.6-7.505). [DOI] [PubMed] [Google Scholar]
- Rodgers Joseph L., Cleveland H. Harrinton, Oord Edwin van den, and Rowe David C. 2000. “Resolving the Debate over Birth Order, Family Size, and Intelligence.” American Psychologist 55(6):599–612 ( 10.1037//0003-066x.55.6.599). [DOI] [PubMed] [Google Scholar]
- Roksa Josipa. 2019. “Intergenerational Exchange of Support in Low-Income Families: Understanding Resource Dilution and Increased Contribution.” Journal of Marriage and Family 81(3):601–15 ( 10.1111/jomf.12558). [DOI] [Google Scholar]
- Sandberg John, and Rafail Patrick. 2014. “Family Size, Cognitive Outcomes, and Familial Interaction in Stable, Two-Parent Families: United States, 1997–2002.” Demography 51(5):1895–931 ( 10.1007/s13524-014-0331-8). [DOI] [PubMed] [Google Scholar]
- Sandefur Gary D., Meier Ann M., and Campbell Mary E. 2006. “Family Resources, Social Capital, and College Attendance.” Social Science Research 35(2):525–53 ( 10.1016/j.ssresearch.2004.11.003). [DOI] [Google Scholar]
- Steelman Lala Carr, Powell Brian, Werum Regina, and Carter Scott. 2002. “Reconsidering the Effects of Sibling Configuration: Recent Advances and Challenges.” Annual Review of Sociology 28:243–69. [Google Scholar]
- Sulloway Frank J. 1996. “Born to Rebel: Birth Order, Family Dynamics, and Creative Lives.” New York: Pantheon. [Google Scholar]
- Thompson Anne, and Hollis Chris. 2003. “Authoritarian Parenting Attitudes as a Risk for Conduct Problems.” European Child & Adolescent Psychiatry 12(2):84–91. [DOI] [PubMed] [Google Scholar]
- Workman Joseph. 2017. “Sibling Additions, Resource Dilution, and Cognitive Development during Early Childhood.” Journal of Marriage and Family 79(2):462–74 ( 10.1111/jomf.12350). [DOI] [Google Scholar]
- Yu Wei-hsin, and Su Kuo-hsien. 2006. “Gender, Sibship Structure, and Educational Inequality in Taiwan: Son Preference Revisited.” Journal of Marriage and Family 68(4):1057–68 ( 10.1111/j.1741-3737.2006.00313.x). [DOI] [Google Scholar]
- Zajonc Robert B. 2001. “The Family Dynamics of Intellectual Development.” American Psychologist 56(6/7):490–96. [DOI] [PubMed] [Google Scholar]
- Zajonc Robert B., and Markus Gregory B. 1975. “Birth Order and Intellectual Development.” Psychological Review 82(1):74–88 ( 10.1037/h0076229). [DOI] [Google Scholar]
- Zheng Xuegang, Su Qianru, Jing Changyu, and Zhang Yang-Yang. 2022. “They Are Not Little Emperors: Only Children Are Just as Altruistic as Non-Only Children.” Social Psychological and Personality Science 13(2):543–52 ( 10.1177/19485506211038190). [DOI] [Google Scholar]
Associated Data
This section collects any data citations, data availability statements, or supplementary materials included in this article.