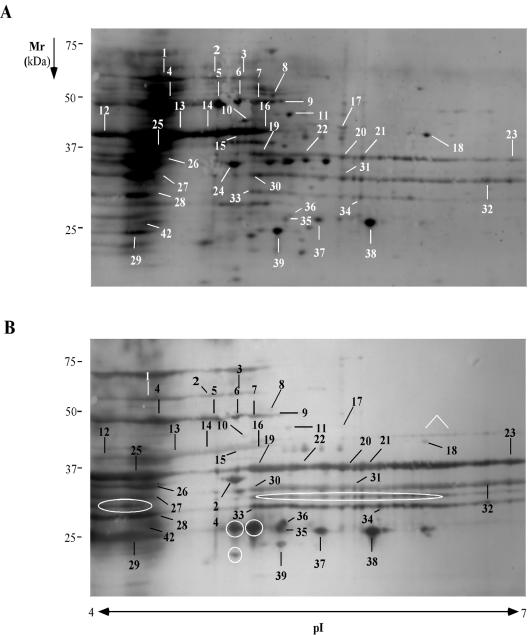
FIG. 2.
Fluorescence-stained blot (A) and immunoblot (B) of a cell surface fraction from S. epidermidis 0-47 grown in 70% rabbit serum separated on pH 4 to 7 IPG strips in the first dimension and SDS-PAGE in the second dimension. The spots were identified by mass spectral analysis and labeled with numbers corresponding to the identified proteins in Table 1. Proteins only present on immunoblot are indicated by white circles and an arrow.

