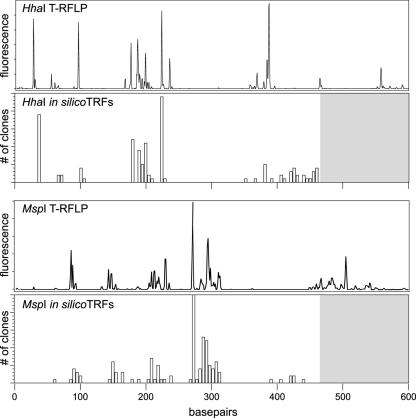
FIG. 4.
Comparison between T-RFLP analysis and in silico terminal restriction fragment length polymorphism analysis. HhaI and MspI TRFs were predicted for each 16S rRNA-encoding gene clone depicted in Fig. 3, with the exception of clones corresponding to H. hepaticus. The in silico-generated TRFs are plotted in histogram format below a corresponding actual T-RFLP trace from an uninfected animal for each enzyme. The gray areas of the histograms above 470 base pairs represent the areas where we would not expect to see predicted TRFs, given that the maximal length of any given partial 16S sequence was 470 base pairs (see Materials and Methods).

