FIG. 7.
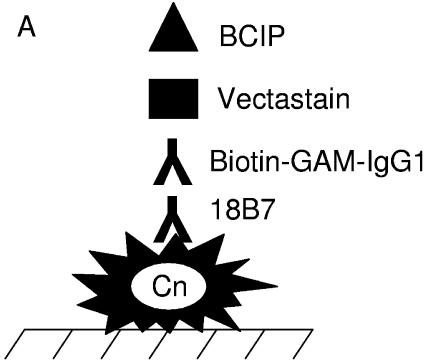
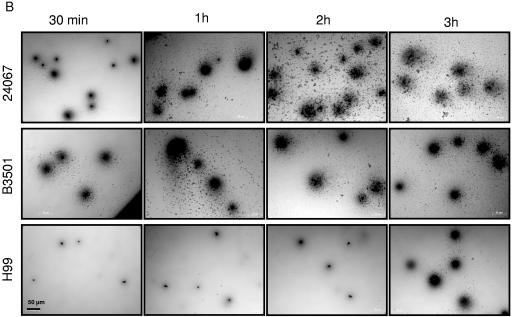
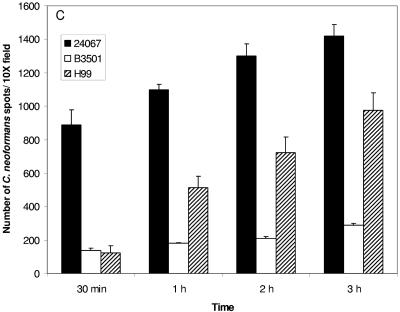
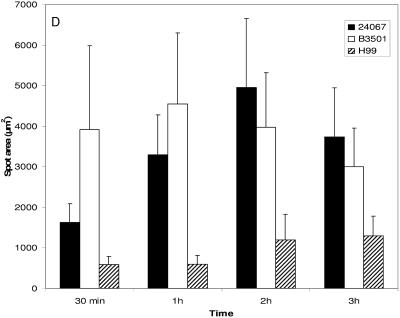
A. Graphic representation of the ELISA spot configuration. The diagram indicates the antibodies (MAb 18B7 and goat anti-mouse [GAM] IgG1 conjugated to biotin) used to recognize the GXM released by C. neoformans (Cn) cells to the bottom of the plate. B. Light microscopic images of spots formed by C. neoformans strains 24067, B3501, and H99 during ELISA spot assay. Images were obtained after 30 min and 1, 2, and 3 h of incubation in polystyrene microtiter plates. Bars, 50 μm. Results are representative of two experiments. C. Spot number in microtiter wells as a function of time for three biofilm-forming strains of C. neoformans. Bars are the average numbers of spots in five power fields, and error bars denote standard deviations. Pictures were taken using a 20-power field. D. Spot area as a function of time for three biofilm-forming strains. GXM amount was visualized by ELISA spot assay. Bars are the averages of the areas of 20 spots per power field with the area being calculated as = πr2. Five power fields were observed per time interval. Error bars denote standard deviations. Pictures were taken using a 20-power field.


