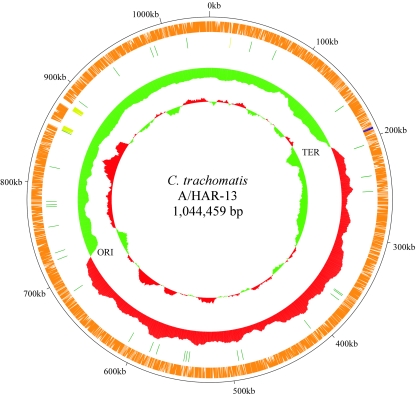
FIG. 1.
Circular representation of the A/Har-13 chromosome. First (outer) circle, alignment of each ORF identified in A/HAR-13 with ORFs in the D/UW-3 chromosomal sequence. Those ORFs that share homology (E value cutoff of ≥1e-10−10) in D/UW-3 are indicated in orange. Those ORFs lacking a D/UW-3 homolog are indicated in blue. Second circle, location of RNA encoding regions; tRNAs in dark green, rRNAs in yellow. Third circle, light green and red represent GC skew calculated as C/G, 20-kb sliding window, with 500-bp incremental steps. Red and light-green profiles signify regional prevalence of C over G compared to the average CG value for the entire chromosome. Fourth circle, regional GC% (over a 20-kb sliding window) compared to the total 41.27% GC% for the chromosome. Red indicates regions with a GC% above the total average, while light green indicates regions with a GC% below the average. The relative locations of the origin of replication (ORI) and terminus of replication (TER) are also indicated.

