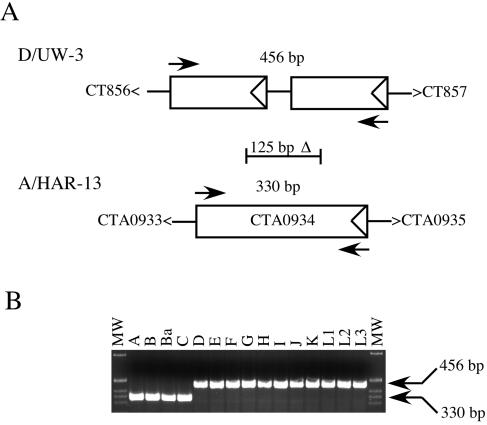
FIG. 6.
Diagnostic PCR amplification identifying oculotropic versus genitotropic strains. (A) Comparison of the ORF arrangement for the genitotropic strain D/UW-3 versus that of the oculotropic strain A/Har-13. The arrows indicate the relative primer binding sites for the diagnostic PCR amplification with the predicted base pair product size noted for each. The location of the 125-bp ocular-specific deletion is also indicated relative to D/UW-3. In addition to the 125-bp deletion, there is a single-nucleotide deletion located in CTA0934, accounting for the 126-bp difference in PCR product size between the two strains. (B) PCR amplification of the 15 C. trachomatis reference serovars. The sizes of the 1-kb DNA ladder (Invitrogen) bands shown are 1,018, 517/506, 396, 344, and 298 bp (from top to bottom).

